Hello traders,
This week has got some amazing setups, let’s hit the charts:
1. USD/CAD
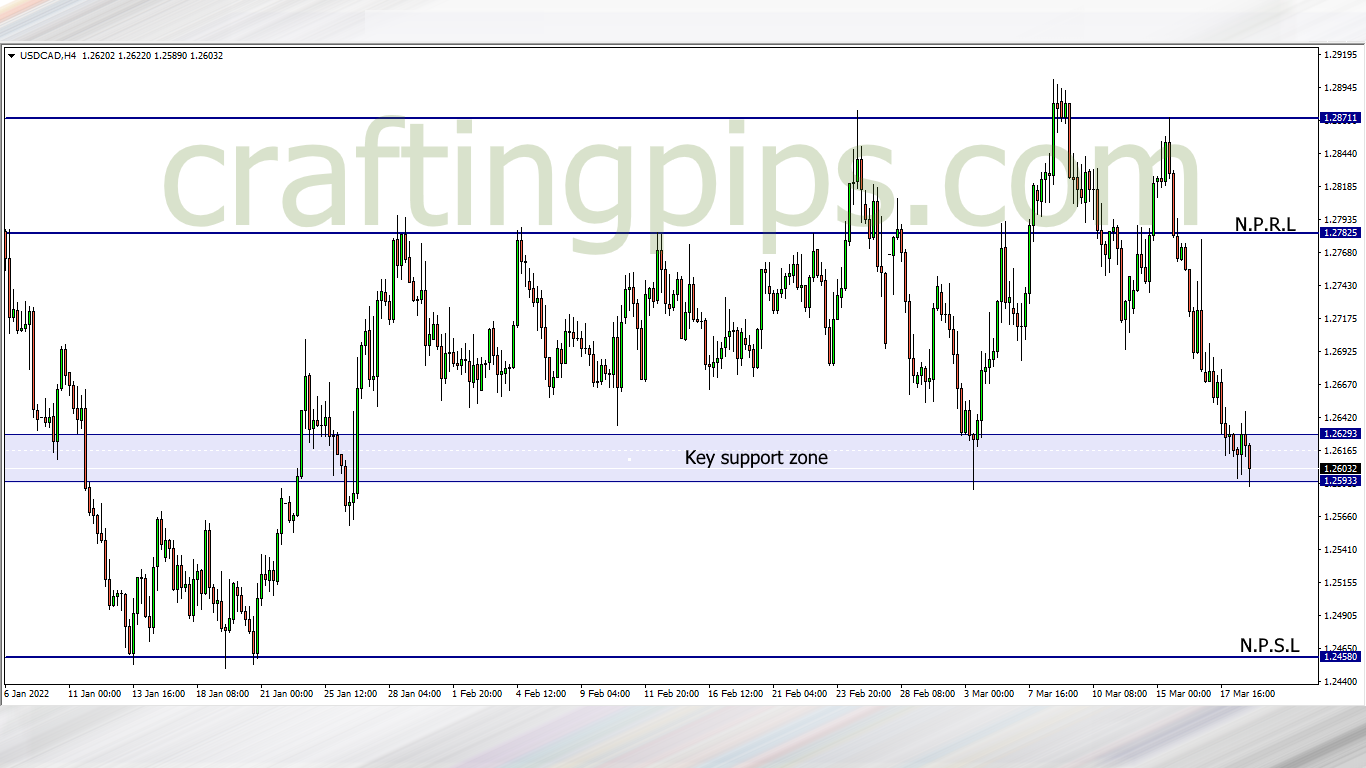
Last week the bears dominated USD/CAD. Price traveled over 270 pips after being rejected by resistance level 1.28711
At the current support zone, we can see price consolidating which tells us that the bulls and bears had a good fight just before the market closed.
A breakout below the present key support zone will encourage more bears into the market and we may see price hit the next possible support level (1.24580). If the bulls manage to take price above the current support zone, 1.26940 will be our next possible resistance level.
2. GBP/USD
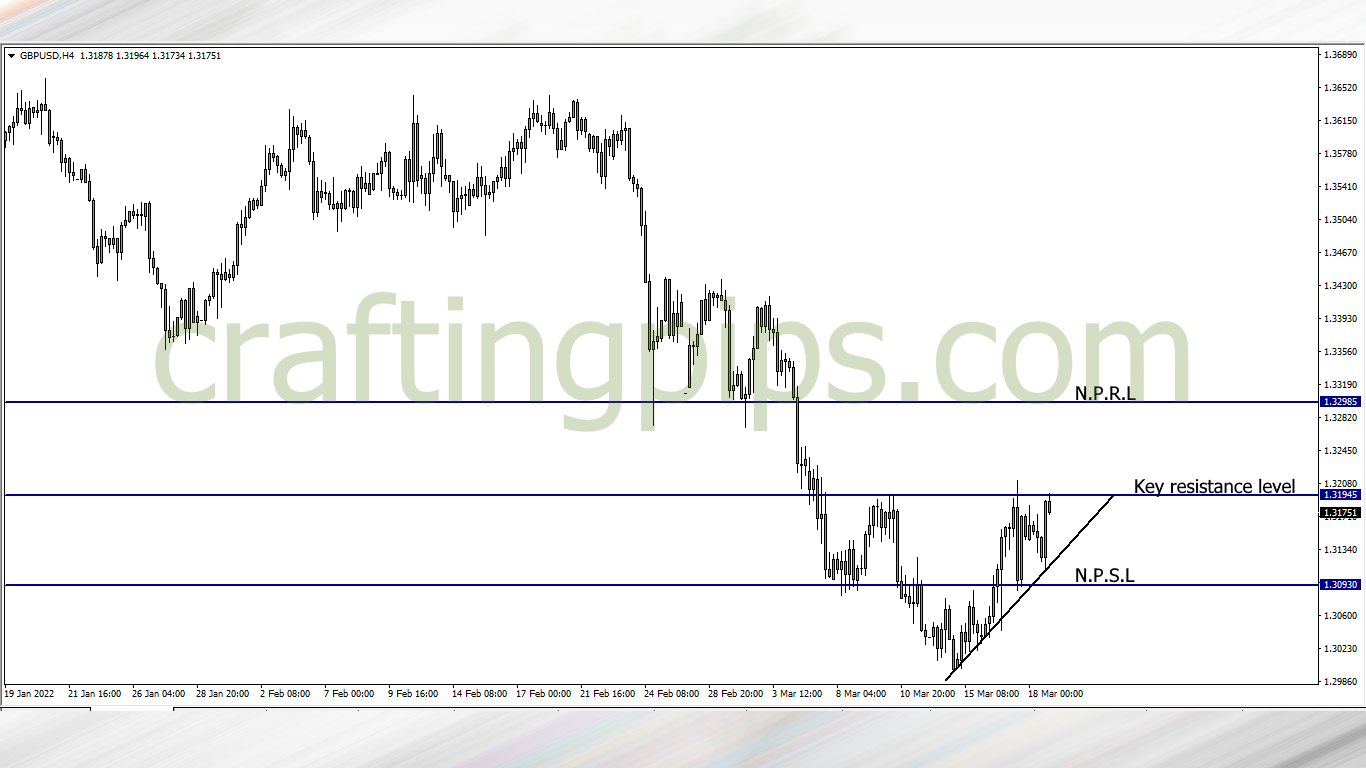
Last week the bulls kept building momentum by forming higher lows, Price got rejected once by resistance level 1.31945, only to close the week by price re-visiting the same resistance level.
This week we may most likely see resistance level 1.31945 subdued by price, and price hitting the next possible resistance level 1.32985.
Let’s not also write off the probability of price breaking through the ascending trendline and returning to support level 1.30930.
3. EUR/USD
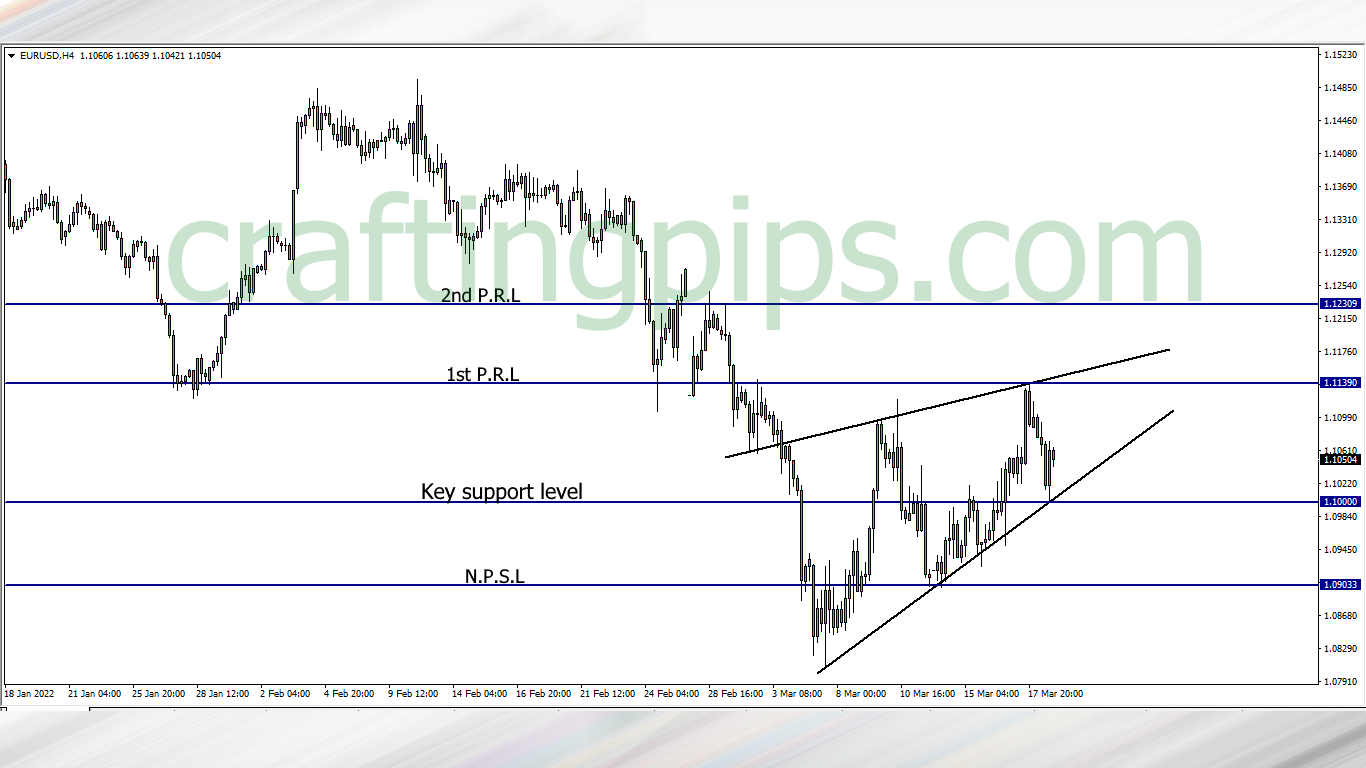
An ascending narrowing channel can be seen on the EUR/USD. Last week closed with price bouncing off support level 1.10000.
Resistance level 1.11390 may get hit if the bulls are still inspired when the market opens. If that happens and the buyers are still dominating, then our next possible resistance level would be 1.12309.
If for any reason, buyers lose steam, and price breaks the key support level, then price may fall to hit support level 1.09033
4. NZD/USD
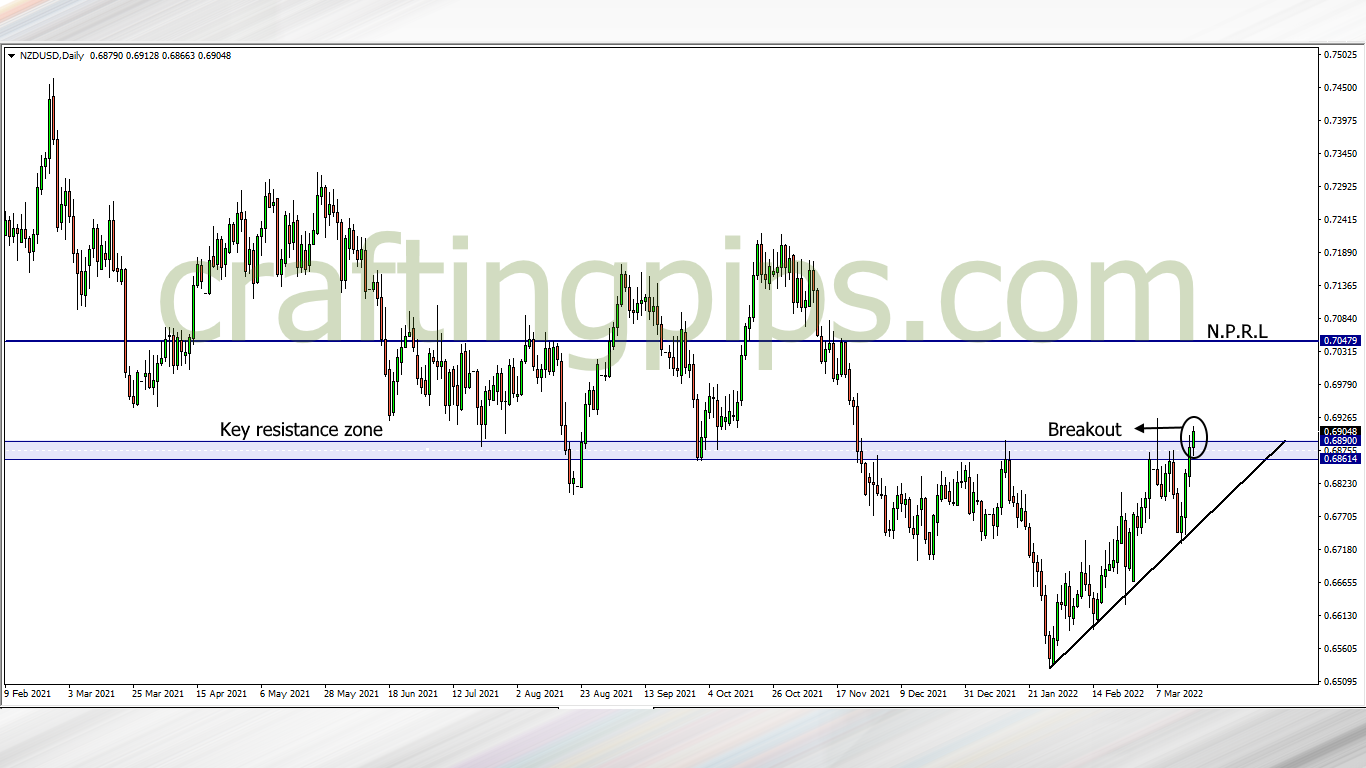
The bulls dominated NZD/USD last week, and not just that, price broke a key resistance zone that has held price below 0.68900 resistance level since last year November.
This week we may most likely see price next journey to 0.70479.
5. NZD/JPY
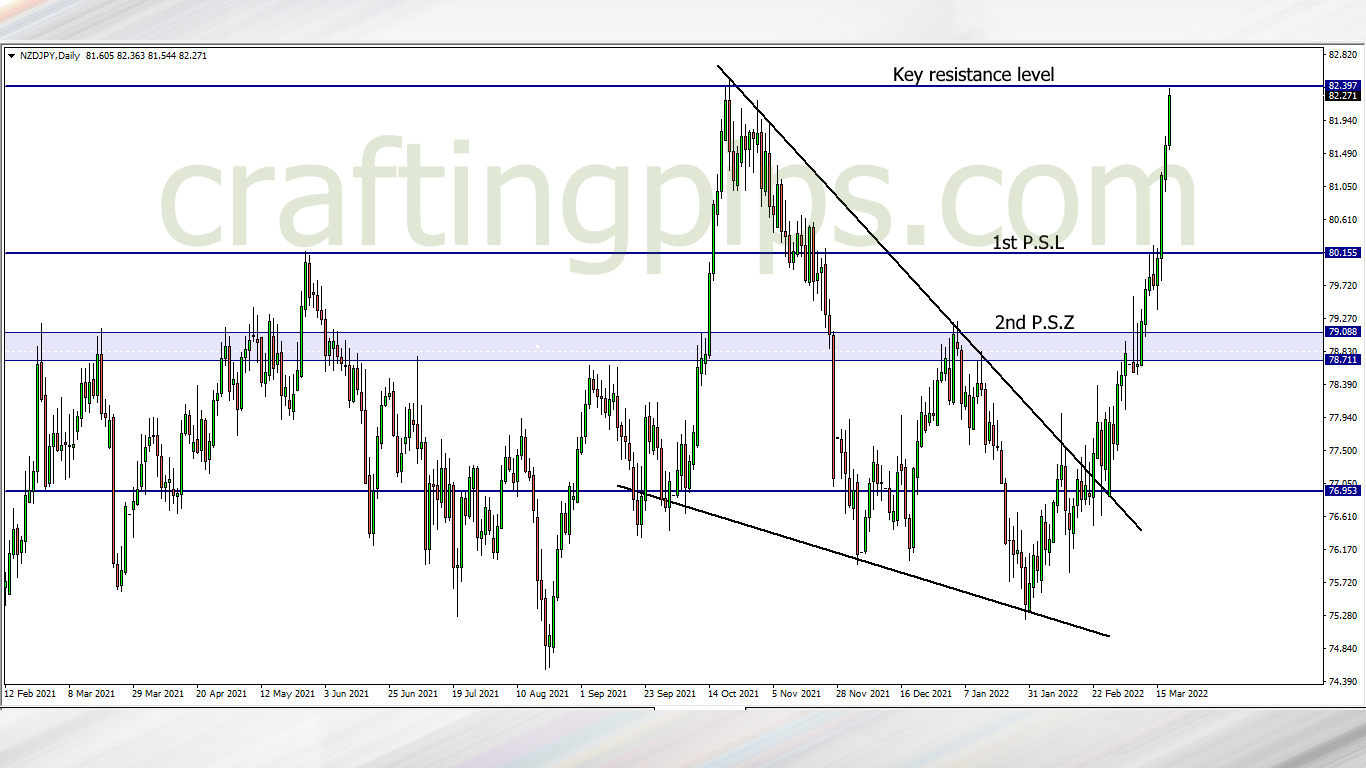
Last week, the bulls went berserk on the NZD/JPY. Price broke resistance level 80.155 with ease and is currently testing resistance level 82.397, which was last tested in October last year.
If price breaks 82.397, then we may most likely see price visit resistance level 83.704, which was last visited in June of 2017.
In my opinion, price present level will most likely be tested, and there is a possibility we see a reversal, which may take price back to support level 80.155 (but that is upon confirmation). This does not mean trader should jump in and start selling
If we do get a breakout this week, then we should be ready to bag over 100 pips as price may hit 83.704
6. CAD/JPY
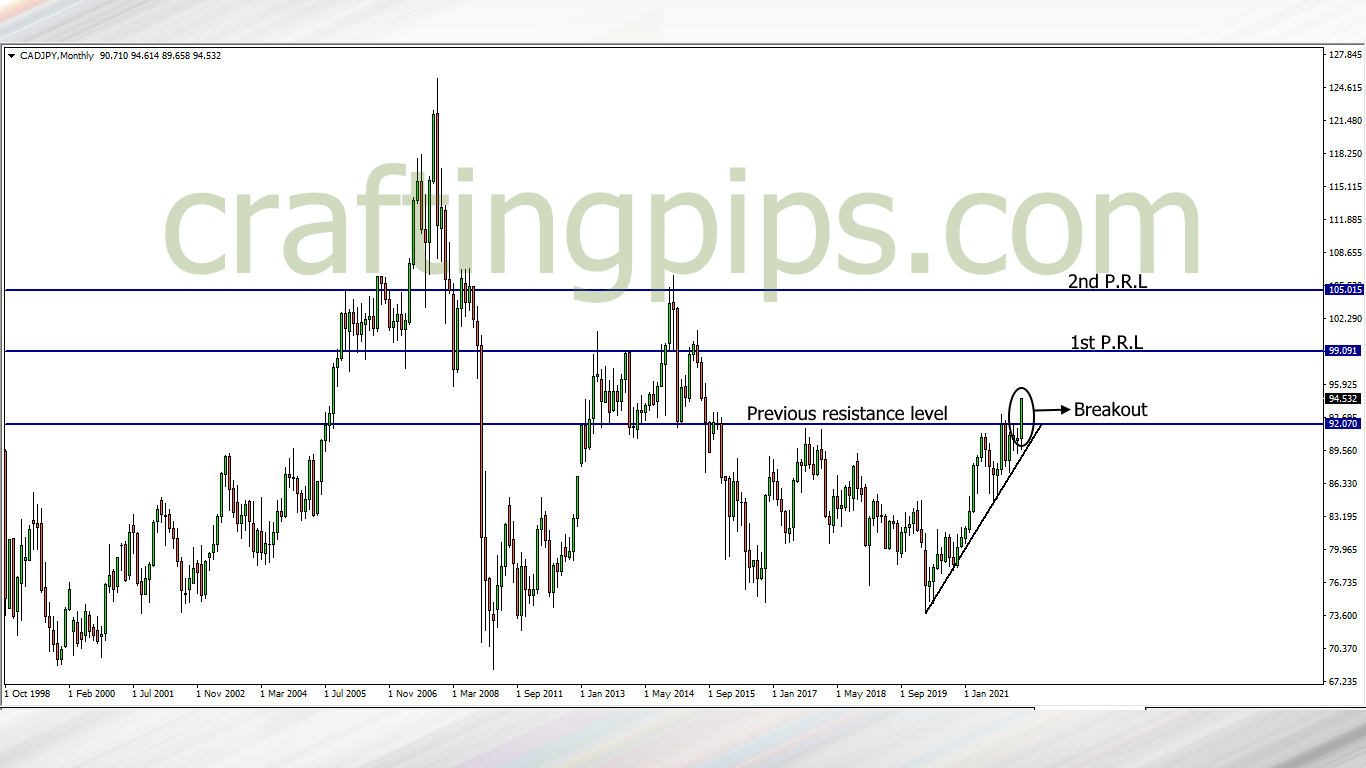
I had to go to the monthly time frame to show this beautiful breakout on the CAD/JPY. If you check the weekly time frame, you will see a clean breakout of price through resistance level 92.070
The last time this phenomenon happened was April of 2013, that’s 9 years ago… how about that?
This week we may see a pullback before price most likely continues another 450 pips to the next possible resistance level (99.091)