Hello traders,
let’s hit the charts before we hit the weekend.
1. EUR/USD

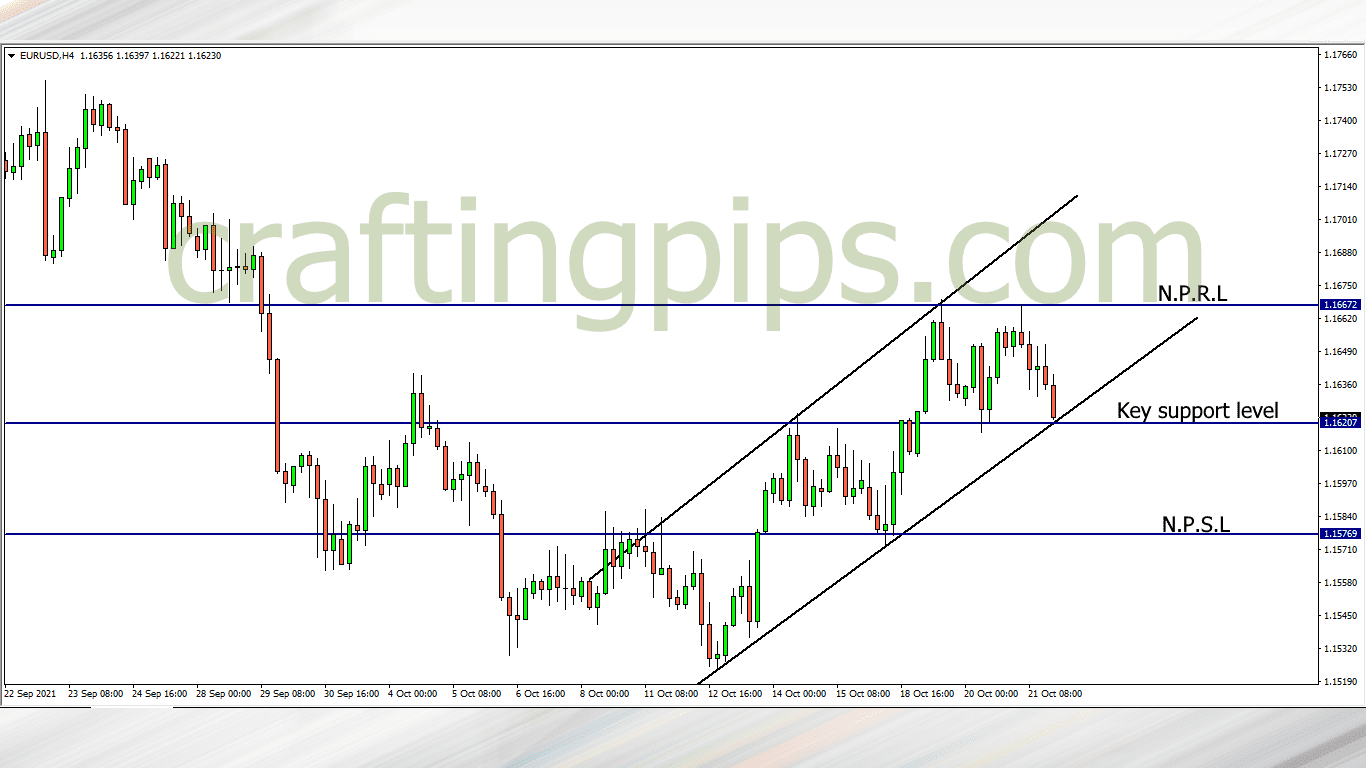
EUR/USD is currently resting on support level 1.16207. The probability of price going bullish or bearish is 50/50.
If we do get a reversal pattern, then price will most likely re-visit resistance level 1.16672, and a bearish breakout through the current support level will most likely encourage sellers to pull price down to support level 1.15769.
2. AUD/USD

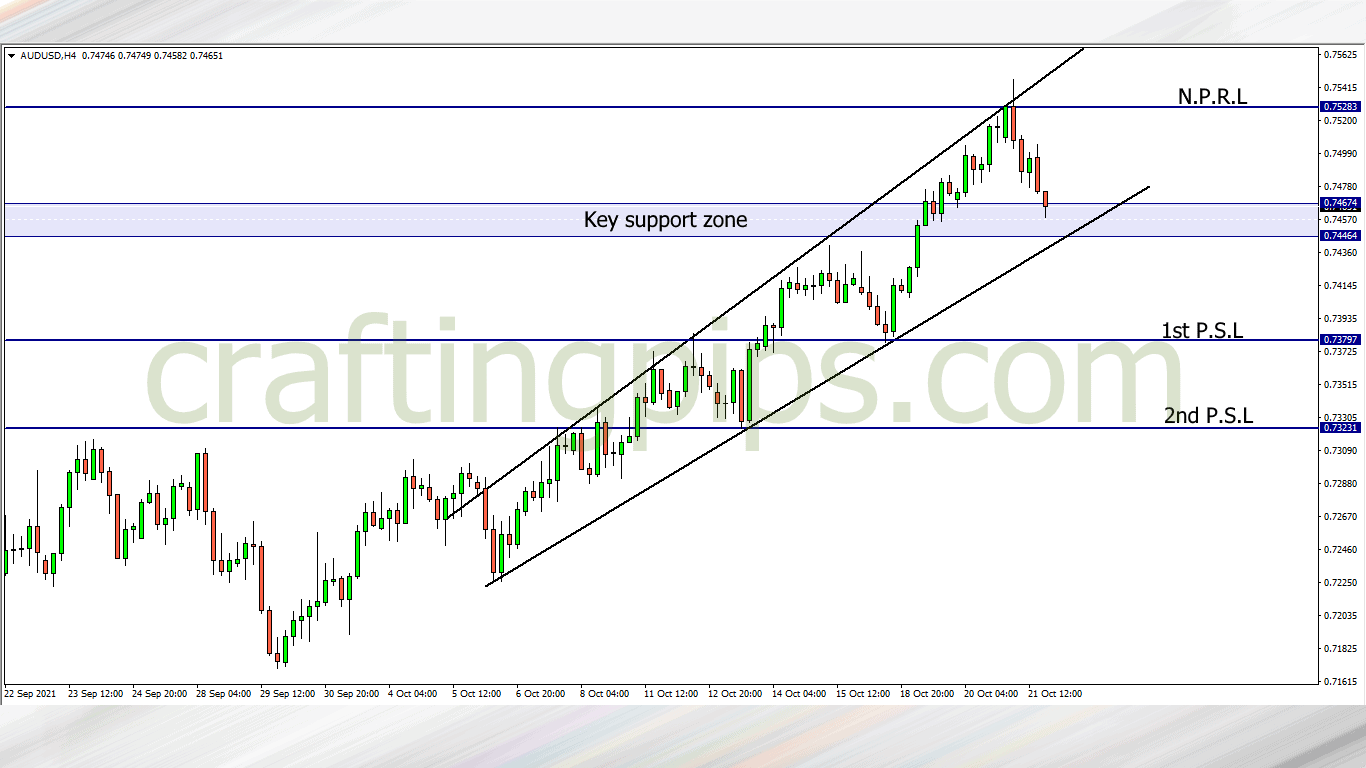
Price on the AUD/USD is within a key support zone. On the daily time frame price hit a major resistance zone (0.75283), and the bears are dominating.
If the daily candlestick closes with a bearish engulfing candlestick, there is a possibility that price will break the current key support zone and hit the 1st possible support level before the market closes on Friday.
If the bulls are still aggressive and we see a bullish reversal formation, there is a chance that price may revisit resistance level 0.75283
3. AUD/JPY

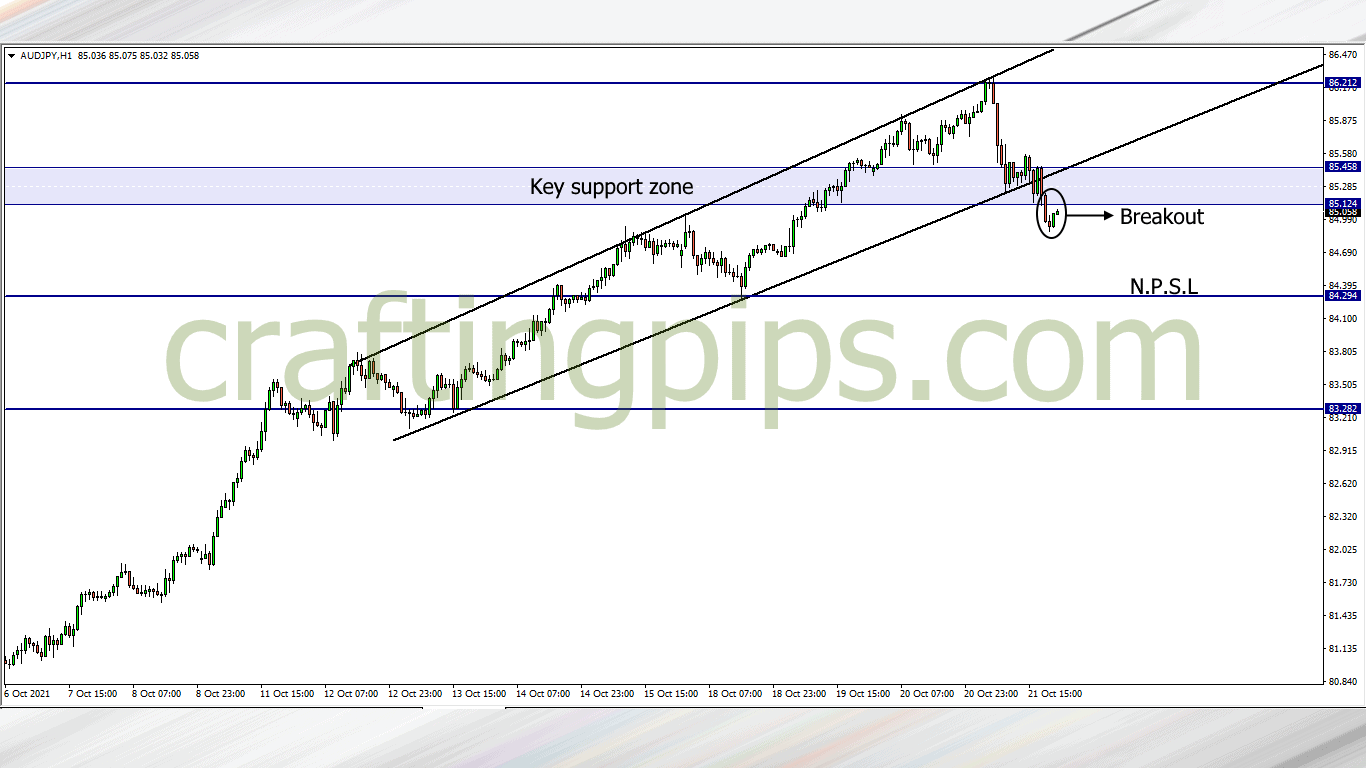
On the AUD/JPY we can see price break through a key support zone on the 1-hour time frame after price was rejected by resistance level 86.212.
Presently we are seeing a pullback, and after the pull-back, there is a possibility that price may continue its journey to the south.
The next possible support level is most likely to be 84.294