Happy Easter all my fellow traders,
How are you celebrating Easter and how are you holding up with the Covid-19 self-isolation?
I am good over here and also keeping myself busy with some little projects.
As for Easter, we are going to celebrate it in our own little way and be merry.
We have no other choice but to remain positive in times like this. Definitely this whole drama will pass too and many comedians will make fun of these times in the nearest future.
That said…
How was trading last week?
Mine was flat, the market was dead slow and I narrowly escaped two losing trades in a row…
In fact, the pair that saved me from having a second consecutive loss was Gold. I bought the pair Monday, and it was supposed to be an intraday trade but…
This precious metal stalled. It got back close to my stop loss and was playing mind games with me. Since I refuse to close it on Monday and the trade still showed no signs of going our way on Tuesday, I basically left the trade to its fate.
Surprisingly, on Thursday it picked up steam and hit TP. Let me share a chart of what Gold looked like when I bought it.
Gold Trade
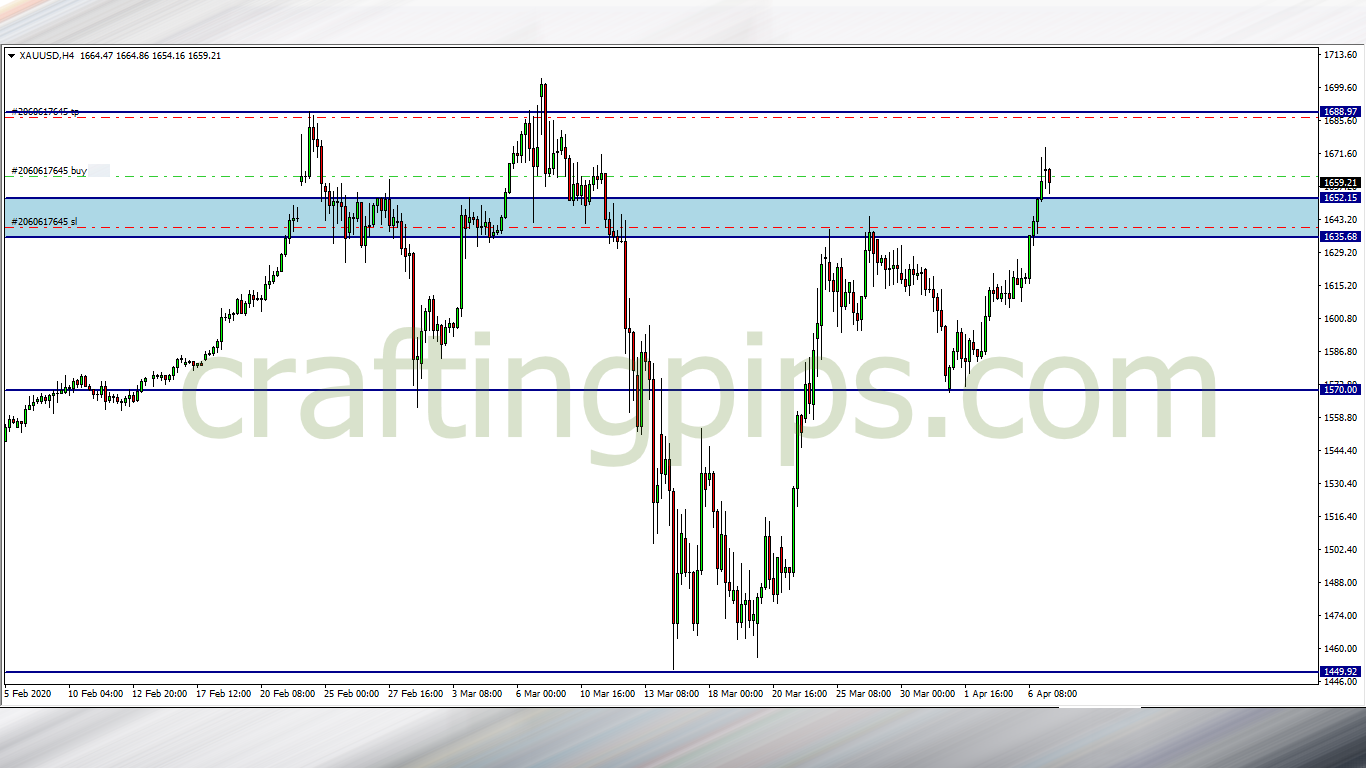
The only thing that kept me alive during those trying days was the fact that I placed a decent stop loss which gave the trade enough room to breathe.
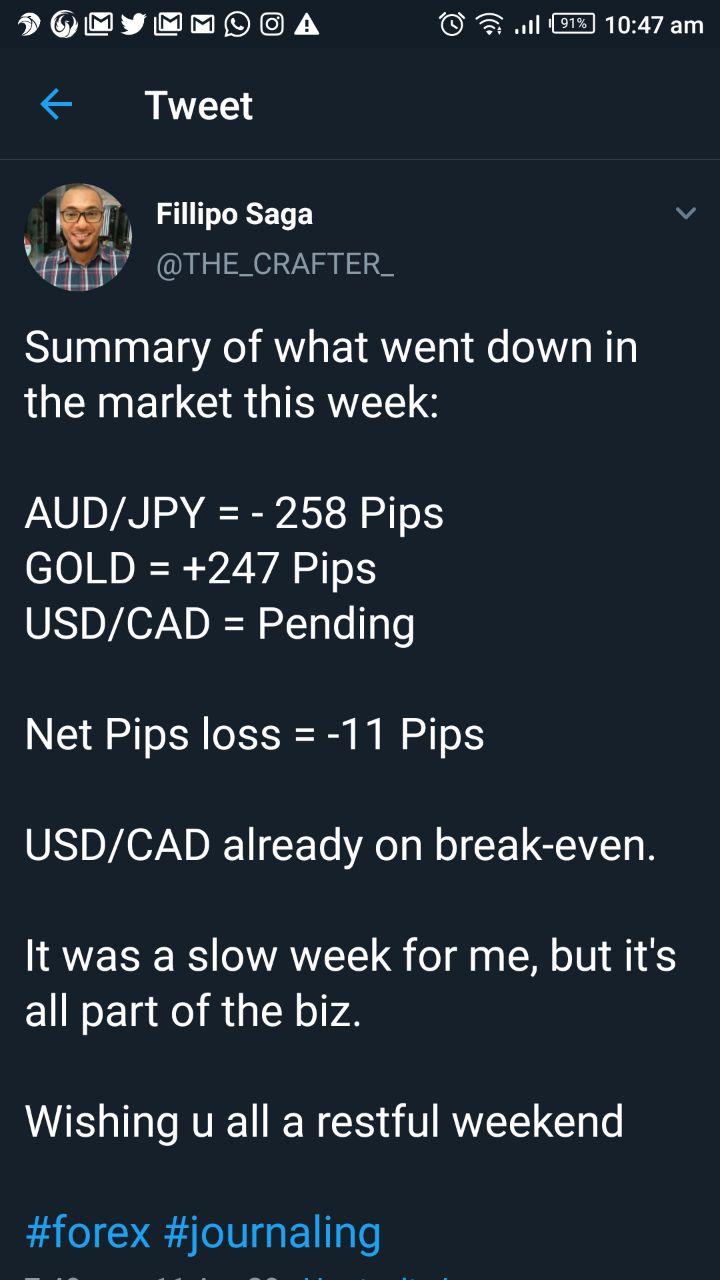
On Saturday, as I tweeted my trade activity for the week, a fellow trader asked an inspiring question which I responded to
Tweet

That was what went down last week in the market.
For the week ahead, let’s see what our charts are saying…
1. USD/CAD
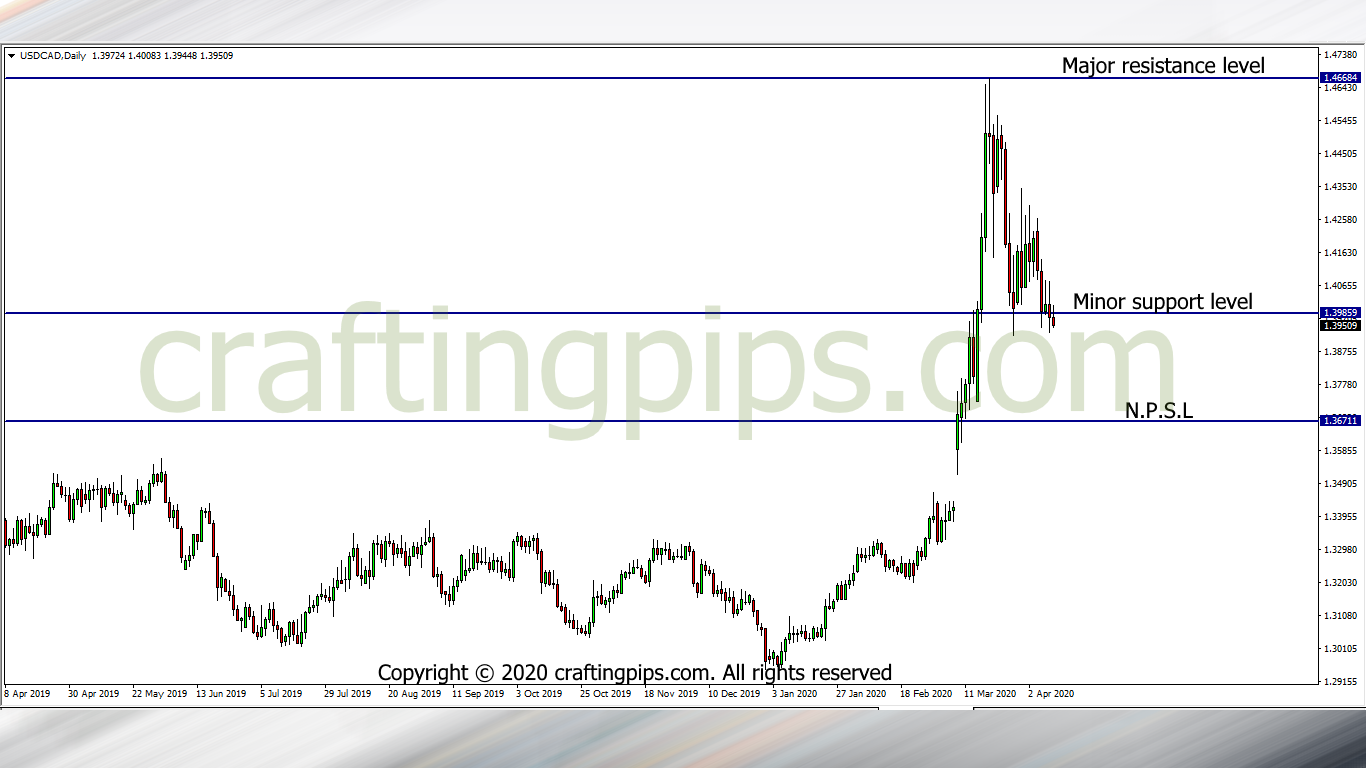
On the daily chart, the USD/CAD has been struggling to break through support level 1.39859 after rejected by a major resistance level (1.46684).
The daily candlestick on Friday closed with a bearish pin-bar just below support level 1.39859, meaning there is still hope for the Bears to pull price further down to the next possible support level (1.36711)
But remember, if you are taking this trade, ensure you apply a decent stop loss.
2. GBP/JPY
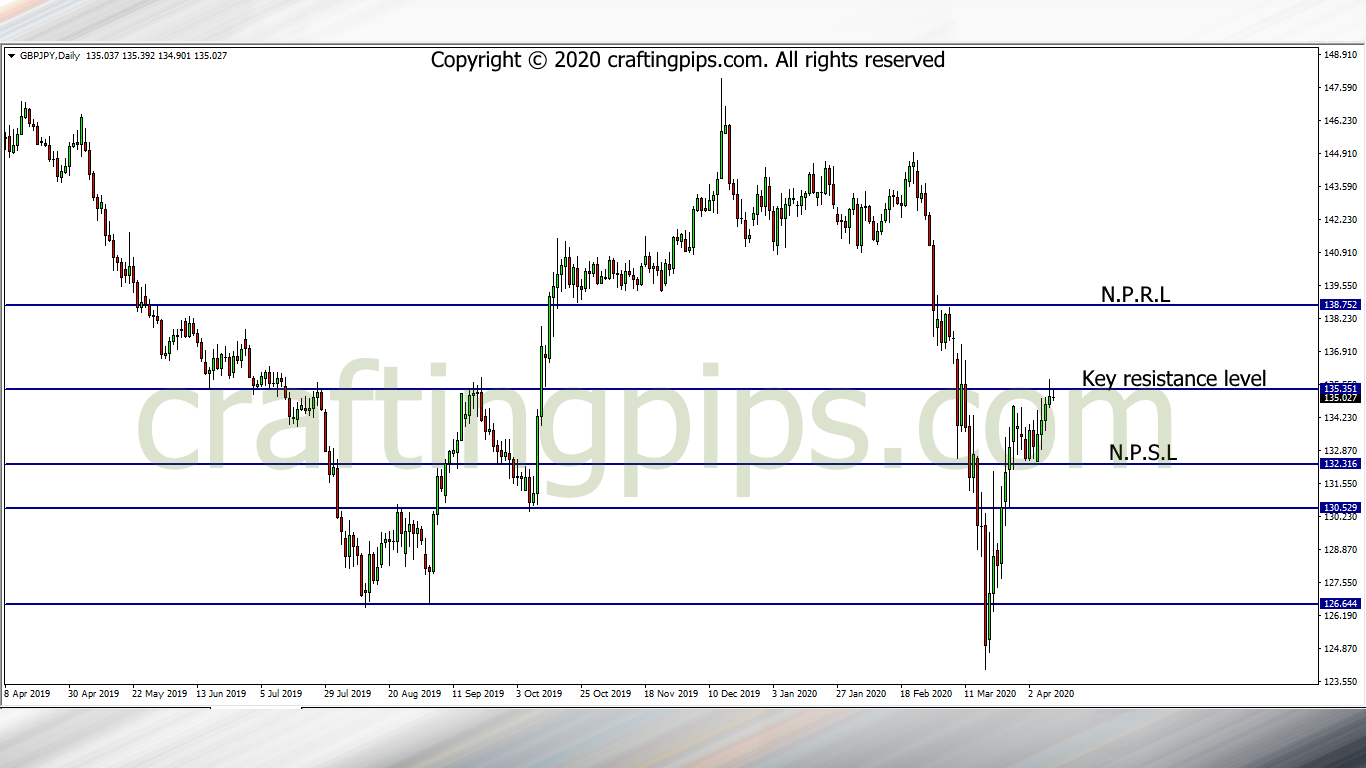
On the GBP/JPY, price closed around the resistance level 135.351.
This could also be the beginning of a head and shoulder pattern formation (if price gives us a reversal at the current resistance level).
I call this a 50/50 trade because we could either see a breakout of price which could drive price to the next possible resistance level (138.752) or a reversal, which means price could revisit support level 132.316.
3. XAU/USD (GOLD)
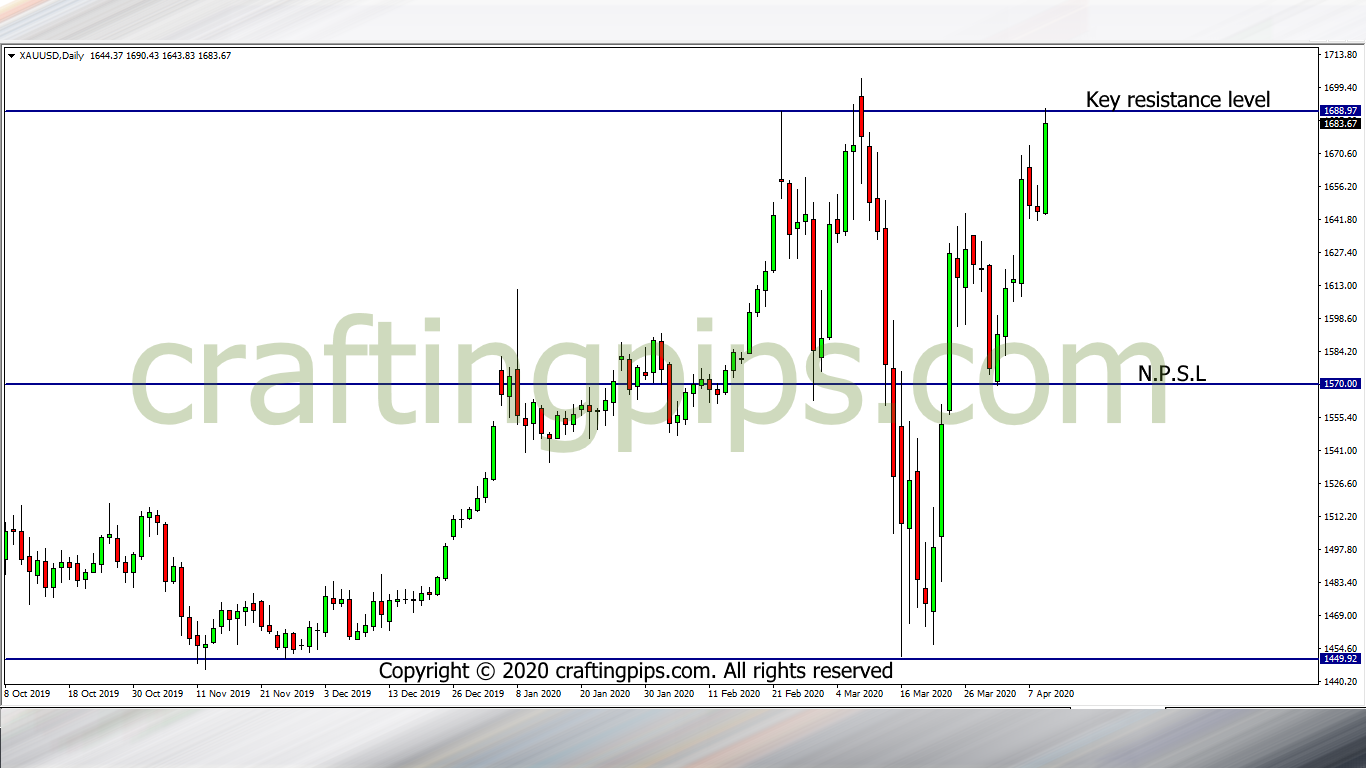
Gold has finally hit resistance level 1688.97, giving us a triple top formation.
A breakout will most likely mean price will start another bullish run to the next possible resistance level (1756.23) and a reversal may encourage price to revisit support level 1570.00.
Another 50/50 trade for us to decipher this week.
What are your views?
Do have a beautiful Easter celebration and do stay safe fam.
![]()
![]()
![]()
![]()
![]()
![]()