Hello Traders,
How was your weekend?
Mine was cool, I basically binge-watched the series “Vikings”.
I came across the series just before X-mas, after hours of surfing the net. I wanted a nice epic series with lots of bloody battles, something to bring me closer to my early ancestors (lol).
So far…, Vikings has been awesome. If you are into watching epic series, I would recommend it.
Alrighty, let’s get back to work.
There are some nice setups lined up for us this week.
Let’s hit the charts.
1. GBP/USD
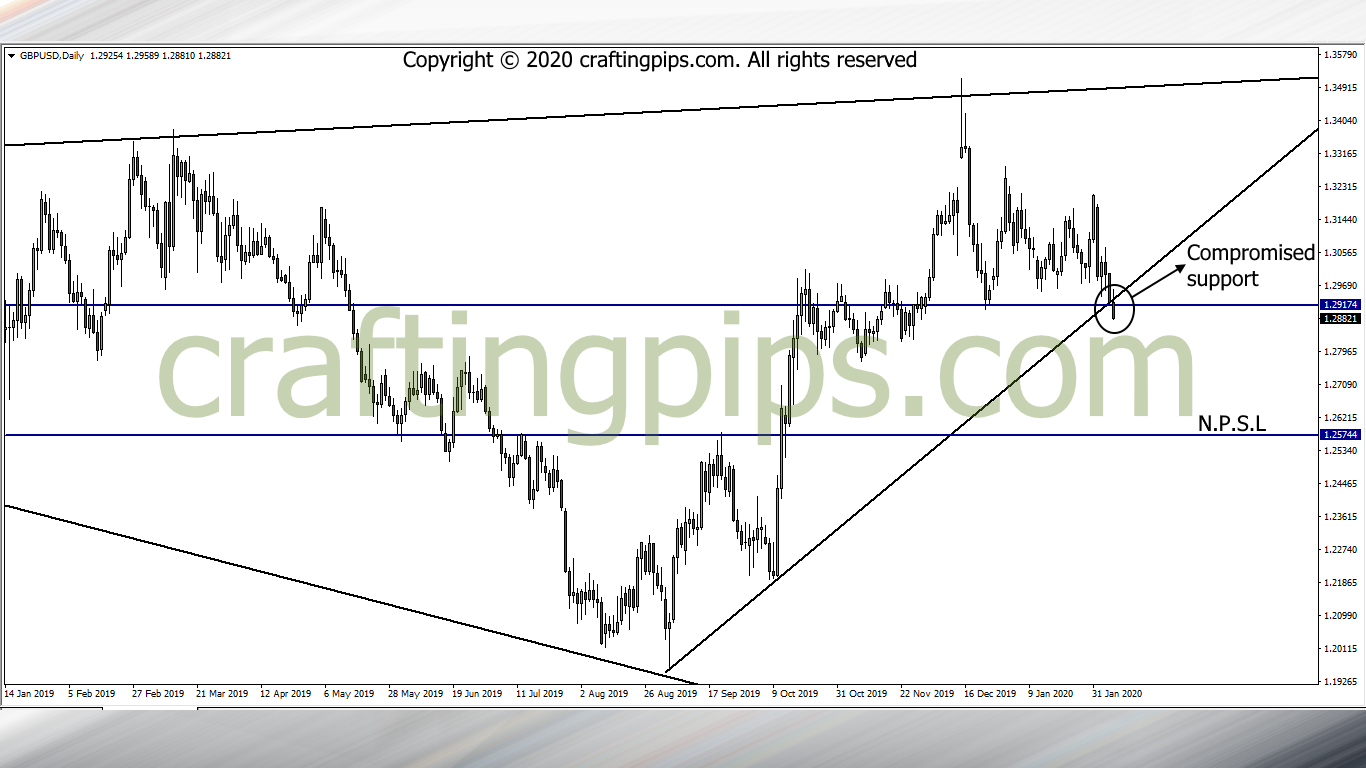
On the weekly chart of the GBP/USD, we have an expanding channel formation and an overall bearish outlook.
On the daily chart we can see a partially broken ascending trendline.
There is a possibility we get a pull-back as the market opens before the sellers pull the market down to the next possible support level (1.25744).
2. AUD/USD
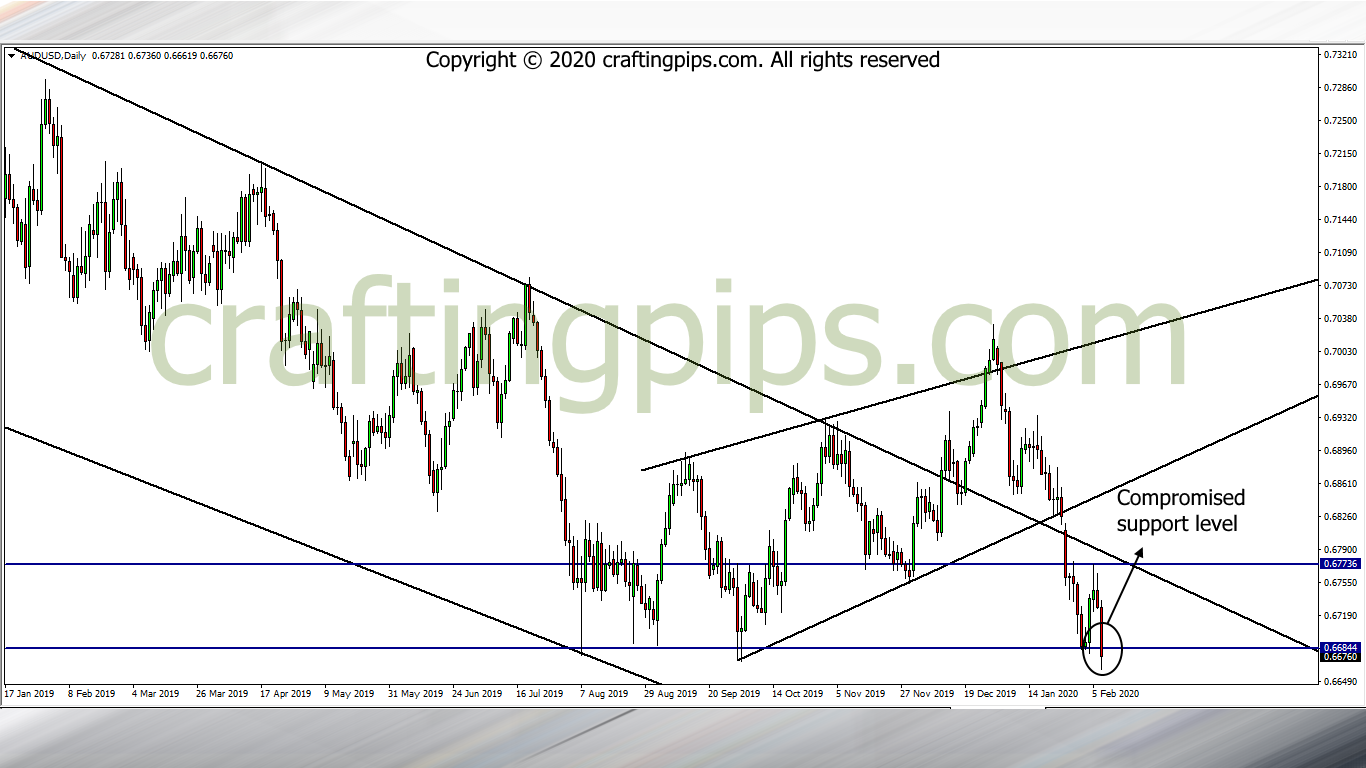
Price on the daily chart of the AUD/USD has been trying to break a very important psychological support level (0.66844) for over 6 months now.
If you ask me… After 5 attempts in trying to break the present support level, I believe support level 0.66844 has become undoubtedly weak.
What I will be looking out for this trading week, will be a sell signal. If we are fortunate enough to get one, we should most likely be eyeing 0.63484 as our next possible support level.
3. NZD/USD
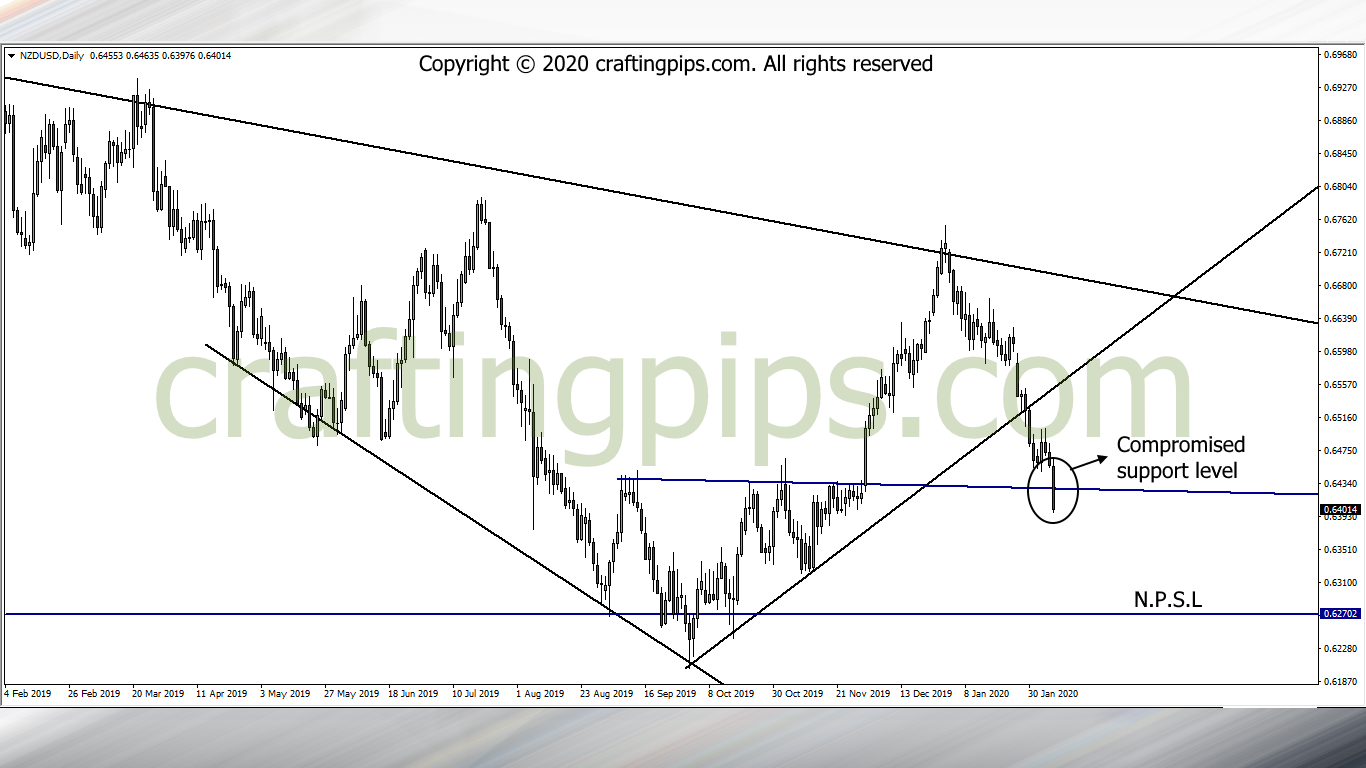
On the weekly chart of the NZD/USD, we have a beautiful descending trendline which has been serving as a resistance level for over 17 months.
On the daily chart, we can see that price closed on Friday by breaking through support level 0.64210.
This week, we should be looking at a possible pullback, before price continues its free-fall to our next possible support level (0.62702).
4. EUR/JPY
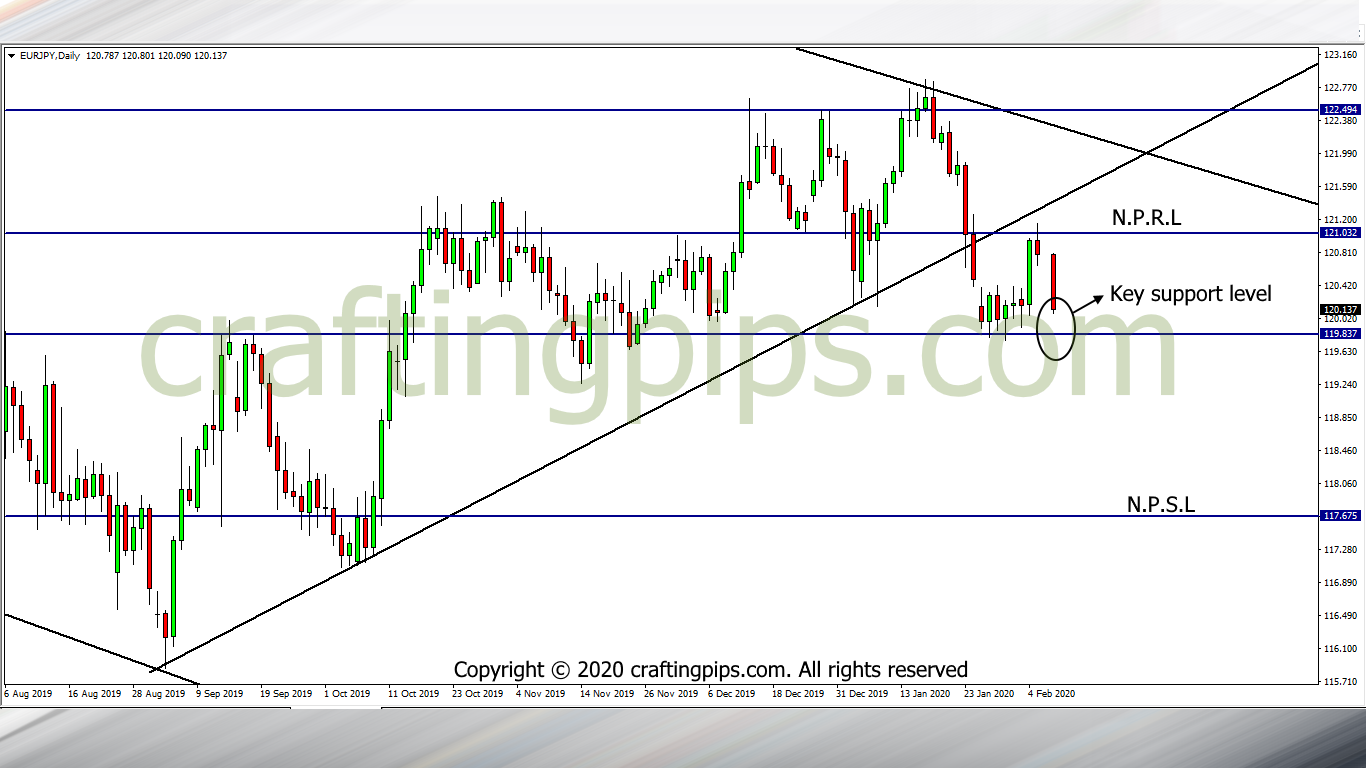
EUR/JPY on the weekly chart has price locked within a descending channel.
On the daily chart, we can see price forming an area of consolidation after breaking out from an ascending trendline.
I am still bearish bias regarding this pair, and all I will be looking out for this week is price breaking out of support level 119.819 before selling.
If that happens, our next possible support level would be 117.675.
So…, we have finally come to the end of our weekly analysis, kindly comment if you have a different view on the market.
Please we would also appreciate it if you also share our content amongst your pip loving community.
Don’t also forget to subscribe to our blog. This will help you get updates on both articles and market analysis as soon as we publish.
Thank you for hanging around fam, and do join us all through the week as we continually analyze the market for your trading pleasure.
As always, do stay pip-full
![]()
![]()
![]()
![]()
![]()
![]()