Hello Traders,
Let’s hit the charts ladies and gentlemen…
1. USD/JPY
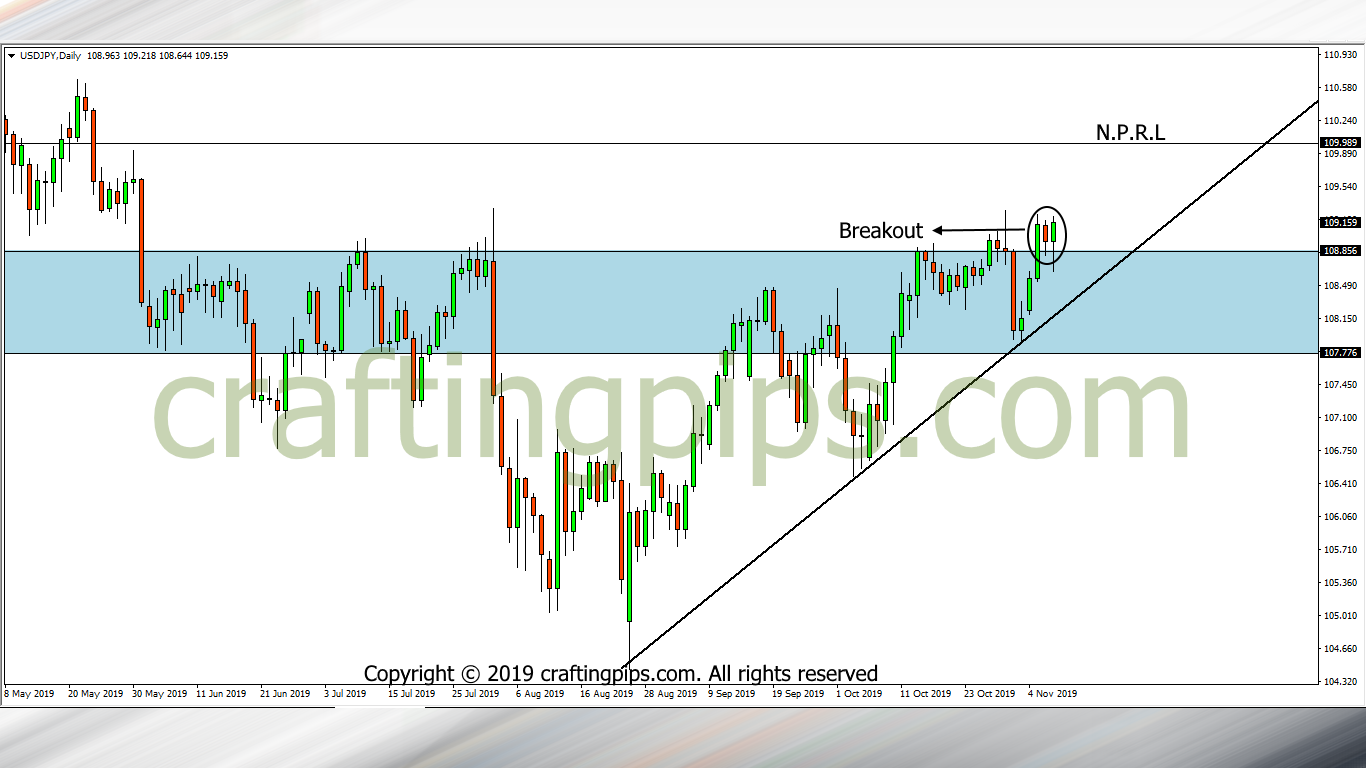
For the past 5 months, USD/JPY on the daily chart has been respecting resistance level (108.856).
If the daily candlestick closes with a bullish pin-bar above the present resistance level, we could be looking at a bullish move for the rest of Friday before the market closes.
We could be looking at price hitting resistance level 109.989 before the market closes
Alrights guys, I wish every one of you a great weekend, and let’s do this again on Sunday
![]()
![]()
![]()
![]()
![]()
![]()