
In my opinion, the Bollinger Band is a cheat indicator for both new and old traders.
Do you want to know why?
Apart from being an easy to use indicator, the Bollinger band also has several uses, which means a new trader does not have to clutter his chart with so many indicators just because he or she is searching for the perfect combo indicator.
Before we go any further, I would love to give credits to the developer of this awesome indicator, and his name is no other than John A. Bollinger, he is also the founder of Bollinger Capital Market which is an investment firm.
I know most of you may be wondering why I used that strange image as the pictorial representation of this article rather than using a typical Bollinger band image.
If you are one of those people, the truth is that I didn’t run out of images to use.
That strange image my friend is the structure of our DNA (deoxyribonucleic acid)
Forget about the mumbo jumbo within the paragraph, just focus on the DNA for a minute.
The DNA structure houses the genetic code of every living thing.
Before I bore you any further with my scientific bruhaha, my reason for picking the image of the DNA structure over the Bollinger band is because of two main similarities.
Similarities of the Bollinger band and the DNA
- Both have two outer bands. While the DNA’s bands house the genetic material of every living organism, the two outer bands of the Bollinger band house price.
- Both the DNA and the Bollinger band ensure their content never spills out of the outer band.
As an enthusiast and a student of science, that’s really comforting.
Knowing that price will always be contained within the three major bands simply tells us that there is a level of security analyzing the market using this trading tool.
That said, let’s note that:
The only reason why the Bollinger band wraps price up as the market moves is due to some complicated mathematical formulas put together by its inventor (John Bollinger).
Thankfully we don’t have to bug ourselves with all of the mathematical complexities because the trading platform we use, deals with that aspect, all we have to do is, study how price reacts within this indicator and apply it efficiently.
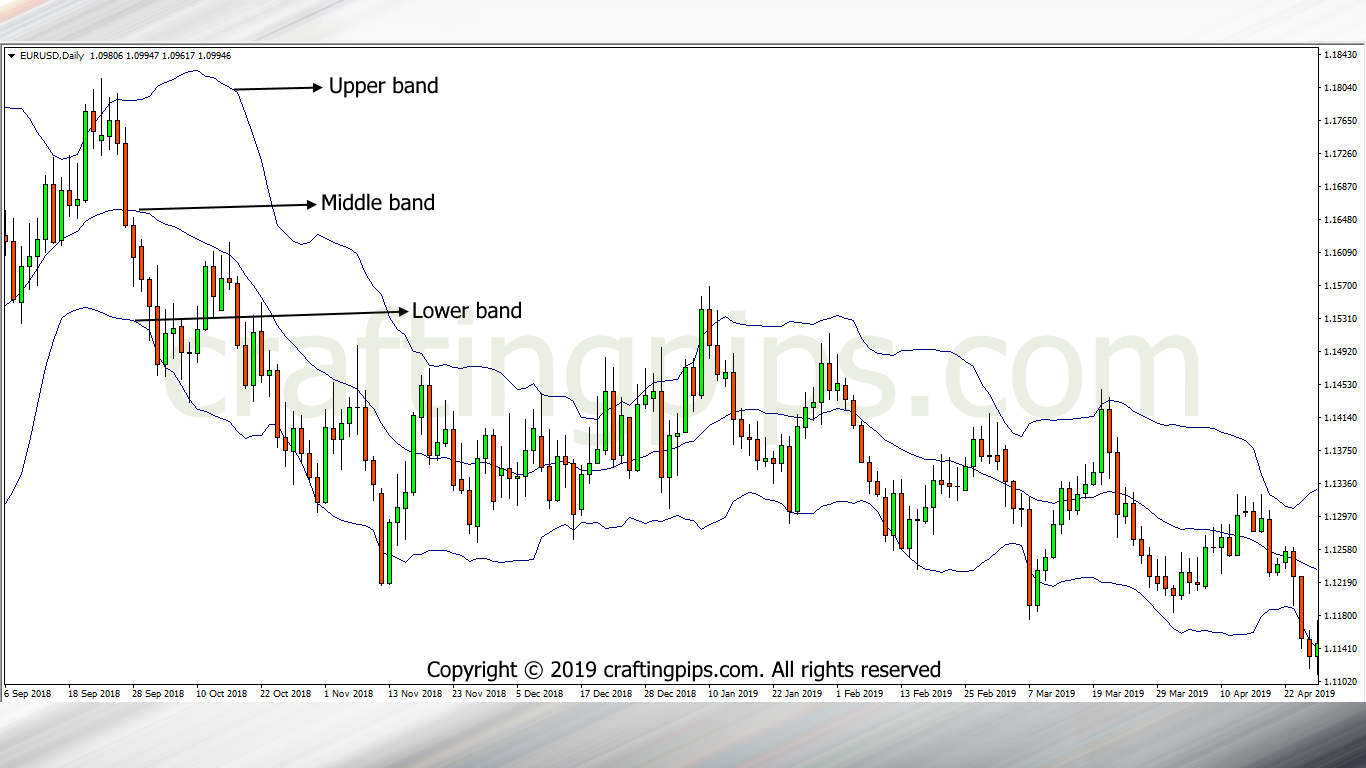
Even if we are not going to use the complicated mathematical formulas the Bollinger band was invented from, it won’t do us any harm to know what these bands represent.
The Bollinger band Characteristics:
- The upper band: 20-day simple moving average + (20-day standard deviation of price x 2)
- The middle band: 20- day simple moving average and
- The lower band: 20-day simple moving average – (20-day standard deviation of price x 2)
There are 6 major reasons why I believe every new trader needs to have the Bollinger Band in his/her trading arsenal:
- Determines a high and low price
- Helps in determining price volatility
- Helps in determining pattern recognition
- It improves your scaling in and out game
- It provides a decent stop-loss order
- It provides a well-defined entry and exit point
1. Determines a high and low price
Just like the structure of the DNA, the Bollinger band encapsulates price.
This is a huge advantage because it helps reveal to traders when price is high and when price is low, especially in a ranging market.
This factor enables traders to know when to buy or sell in a ranging market.
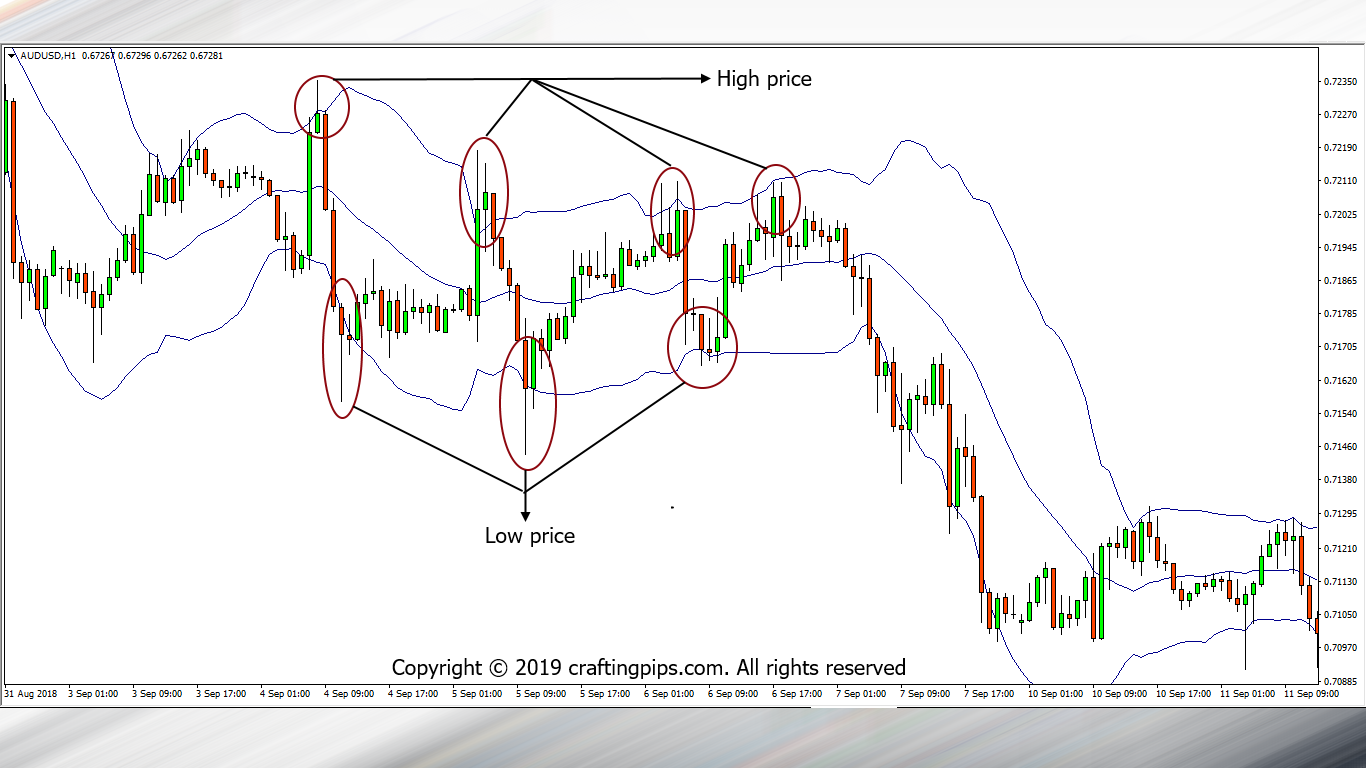
In most cases, a high or low price is determined by price either:
- Touching the upper or lower band
- Piercing the upper or lower band or
- Price getting close to the upper or lower band
2. Determining high and Low volatility
Sometimes in the market, traders do take trades when there is low volatility.
In such instances, waiting for the market to pick up momentum could be time-consuming, and in a few cases when volatility finally returns, there is a possibility that such traders end up being on the wrong side of the market.
The Bollinger band helps in such scenarios.
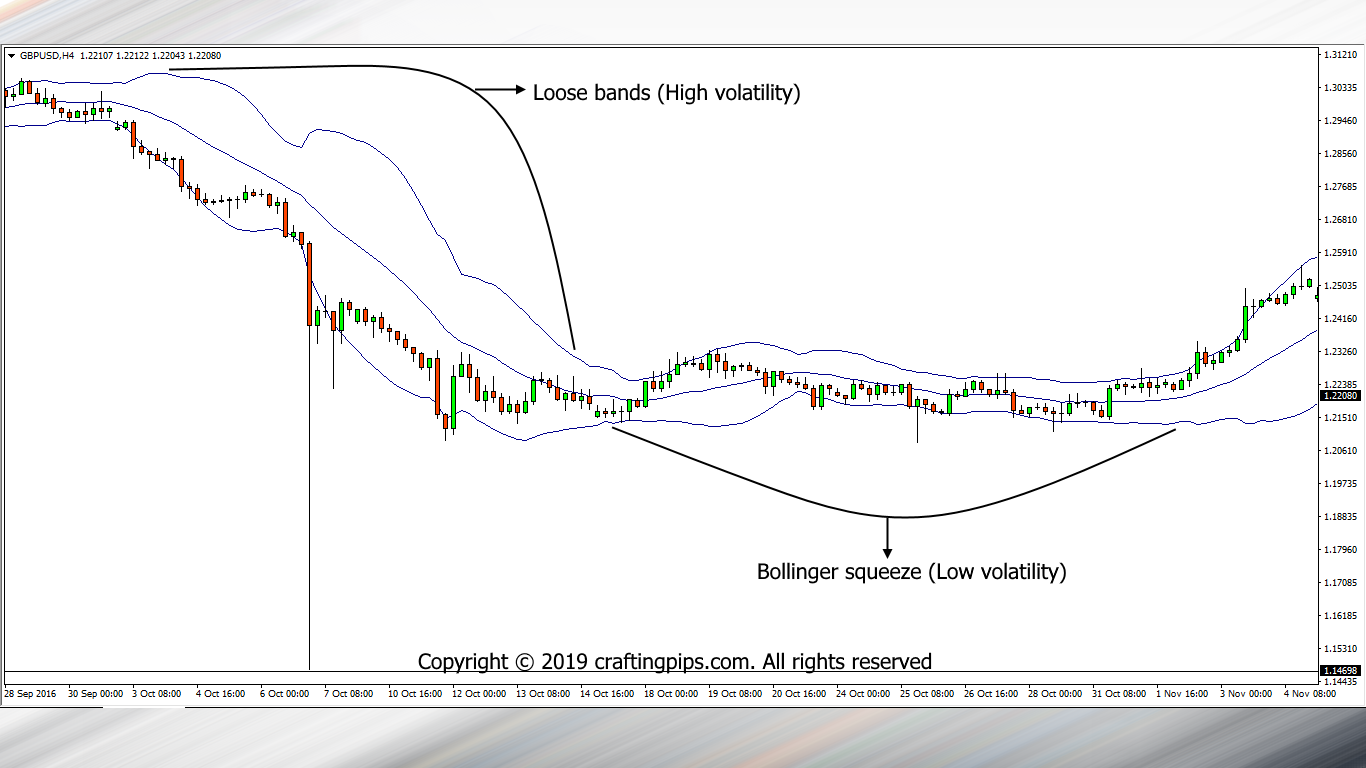
High volatility: In such cases what you notice is that the three bands become loose and the distance between them is much.
As a trader, these are the kind of market you want to be trading. You spend less time taking profits and the direction of the momentum becomes obvious.
Low volatility: When there is low volatility in the market, the bands signify this by becoming narrower (The Bollinger squeeze).
Every trader should always pay close attention to the market when this happens.
The reason is that: A period of low volatility almost always ends with an explosive price move.
So, anytime you notice a Bollinger squeeze, be like a shark that senses a drop of blood in the ocean even when its thousands of kilometers away.
3. Pattern Recognition
Sometimes as traders, we do miss out on some good setups. This happens even to the best of traders in the profession.
Missing a good setup could also be caused by indecision predicated on not properly recognizing the early formation of a pattern.
The Bollinger band helps in detecting early signs of a pattern formation, hence you are ahead of the game in detecting any pattern you trade.
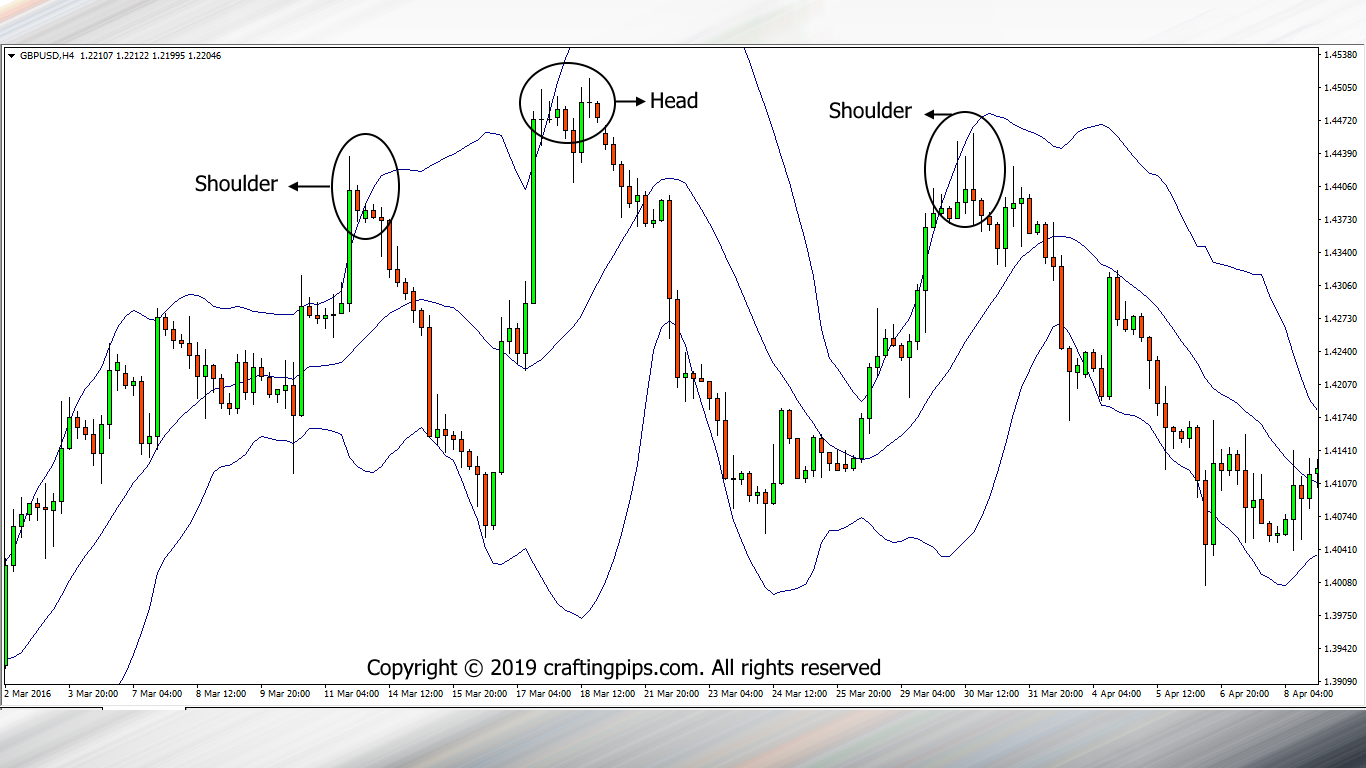
- Head and Shoulders
If we take a close look at the chart above, we will notice that, at the point where price touches the outer band of the Bollinger band, there is a consolidation of price, further giving a trader signs of a reversal to occur and the perfection of a pattern.
Being able to recognize such turning points in the market could be a game-changer when applied properly.
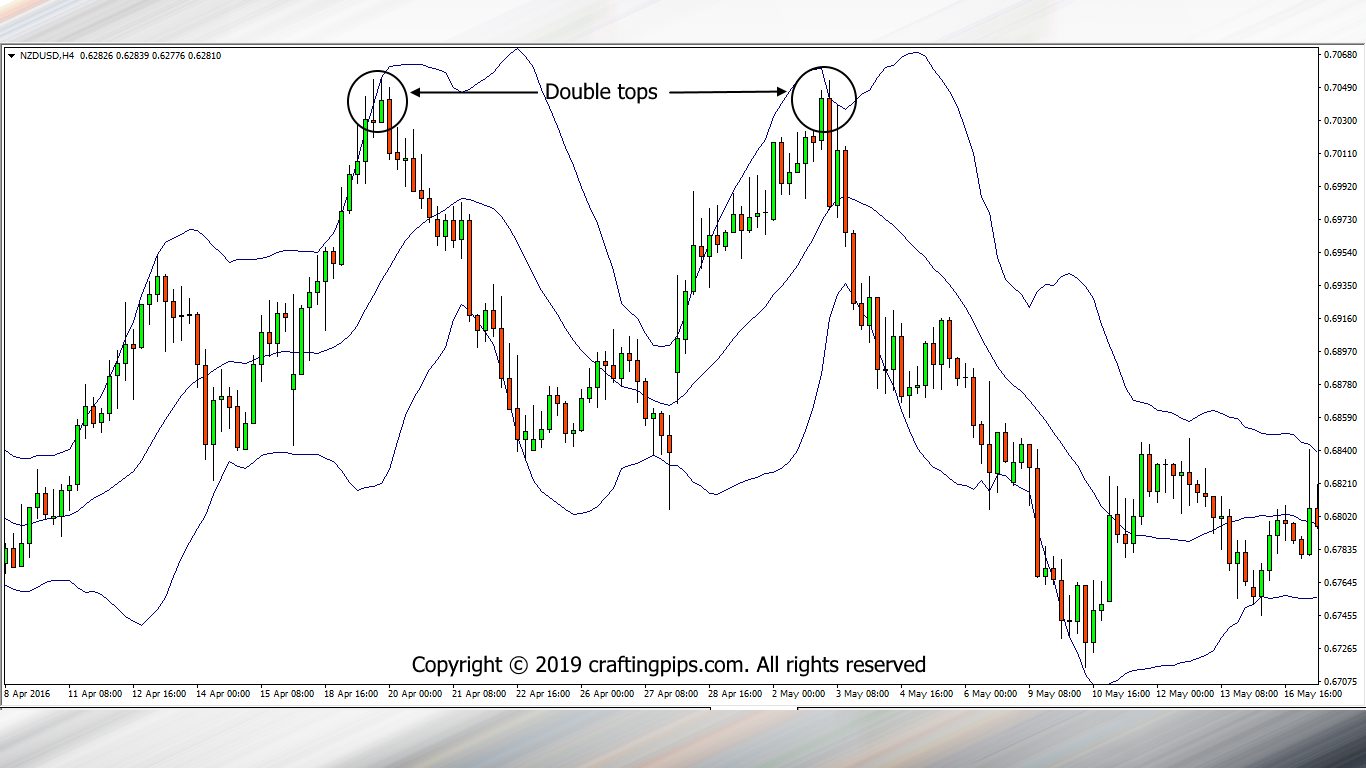
- Double tops
Looking at the double top formation, we can also notice that, as soon as price hit the outer band of the Bollinger band ( of the second top, which is also in-line with the first top) there was a huge bearish engulfing candlestick, which to me is the second confirmation of a reversal.
The same goes for MOST of the other patterns we are familiar with. Price tends to respect each of the bands.
4. It improves your scaling in and scaling out technique
There are few traders who execute this delicate technique with utmost precision.
Yes, I call it delicate because it takes a level of experience to pull off such a trick on a real account.
The good thing is:
The Bollinger band makes this technique a whole lot easier than it actually is.
For those who are not familiar with what scaling in or out of trades mean, I will explain.
Some breakout and reversal trades allow multiple entries at different price key levels. There are several ways of accomplishing this technique, but let’s see how the Bollinger band simplifies it.
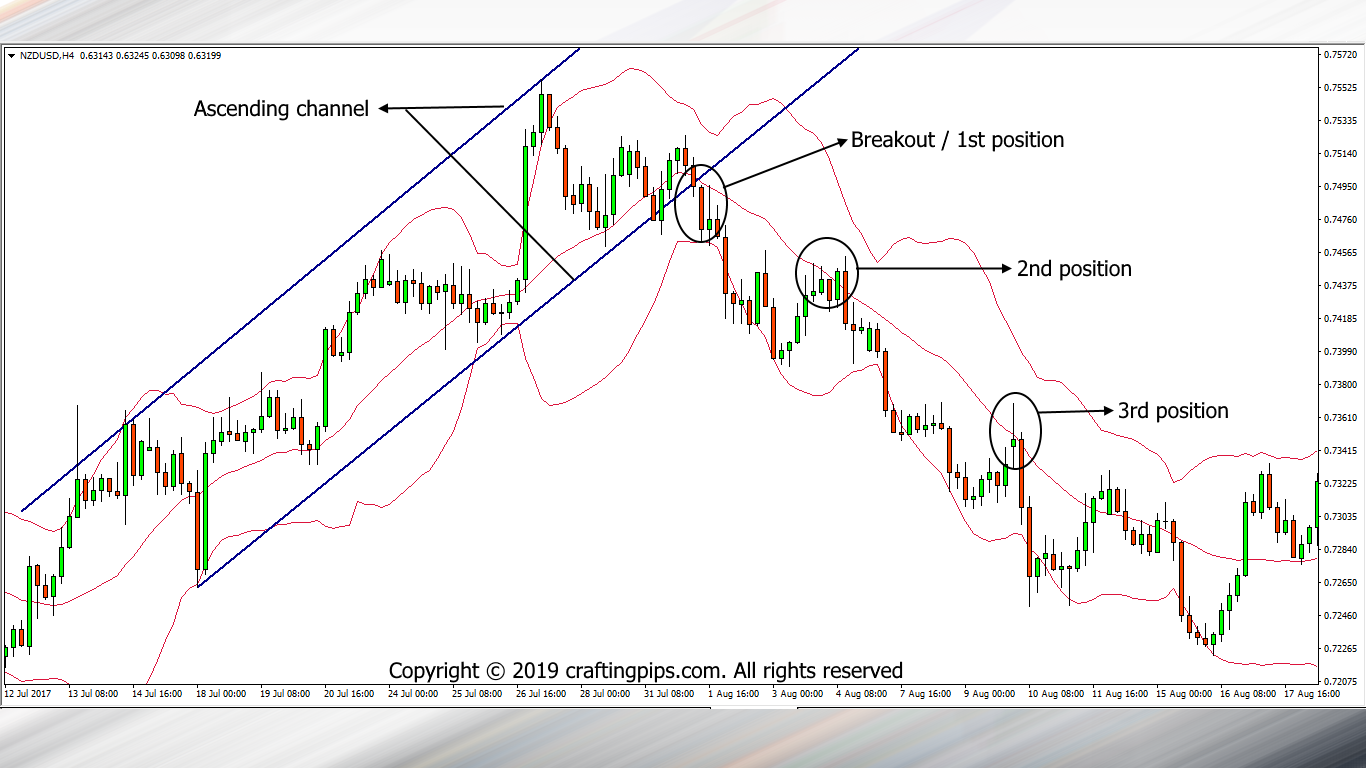
In the chart above we can see an ascending channel which price respects.
On the 4th bounce within the ascending channel, There was a consolidation of price which signifies that price has lost buyers steam.
Afterward, a breakout occurred, with a strong bearish candlestick (which ought to be our first sell entry).
As price goes further down after the breakout, we can see a rejection after price hits the lower band.
Price then bounces back up, but cannot get past the middle band, hence it forms a consolidation (which should be our second entry) before going further down.
As price goes further down for the second time, the process is repeated by price again touching the middle Bollinger band (which should be our third entry) before price continues it’s bearish move
In each of these key levels (middle Bollinger band), the middle band presents to us new trading opportunities while adjusting the exposure of our initial entries that were taken (will be talked about on another article).
By so doing, we could be having several positions within a single trade, with almost NO RISK involved when properly executed.
5. It provides a decent stop-loss order
Placing a stop loss on trades taken has never been this easy.
You really don’t have to be a rocket scientist to do so.
Let’s look at two different ways a stop loss could be placed using a Bollinger band.
- In a ranging market
When selling, place your stop loss above the outer band of the Bollinger band.
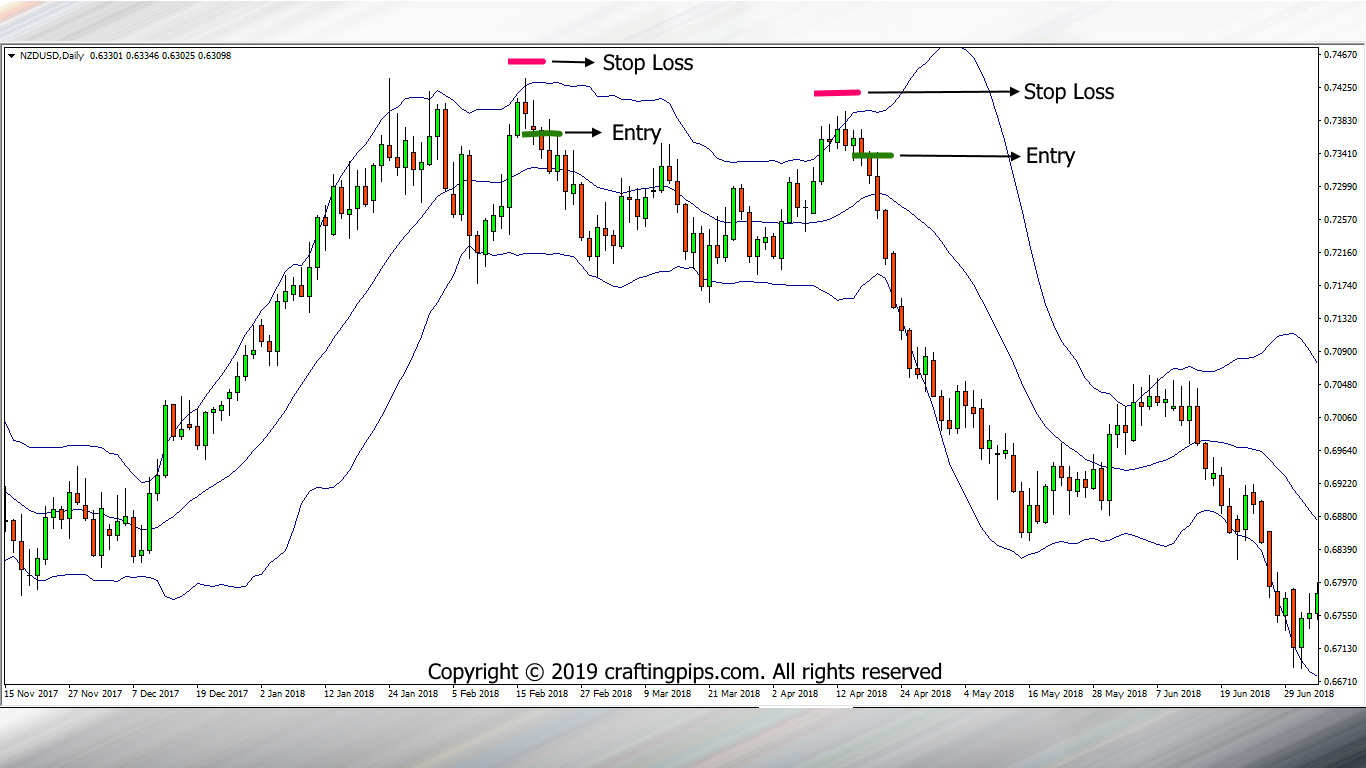
- In a breakout
When there is a breakout, placing a stop loss is even easier because all you have to do is pick a spot above the middle band.
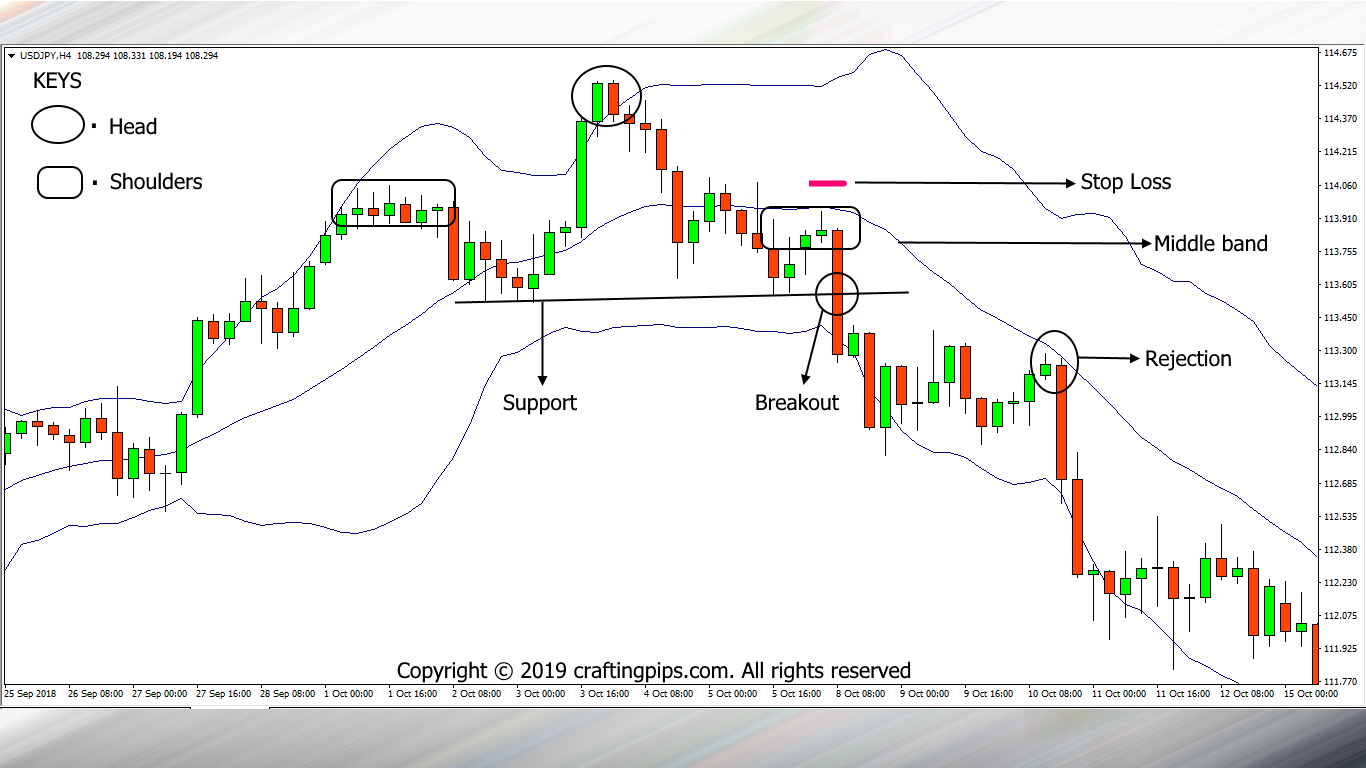
In the chart above we can see a head and shoulder formation.
The breakout of price can be seen with a strong bearish candlestick (Marubozu). Also notice how the middle Bollinger band acted as a strong resistance level?
In such a scenario, we could easily place a stop loss ABOVE the middle Bollinger band and go to sleep.
If you go further down in the above chart, you will also see that the middle band rejected price again, which aligns with our scaling in methodology.
So, in both scenarios, the Bollinger band helps to assist us in placing world-class stop loss order.
6. It provides a well-defined entry and exit point
What’s the point of getting into a trade, if we don’t know when to get out.
Right?
There is no standardized entry and exit point in trading, however, we could depend on the Bollinger band to help us out with both.
For exits, we will look at two classes of traders and how they exit a trade using the Bollinger band.
We have the:
- Conservative exit trader and
- Less-conservative exit trader
i. Conservative trader
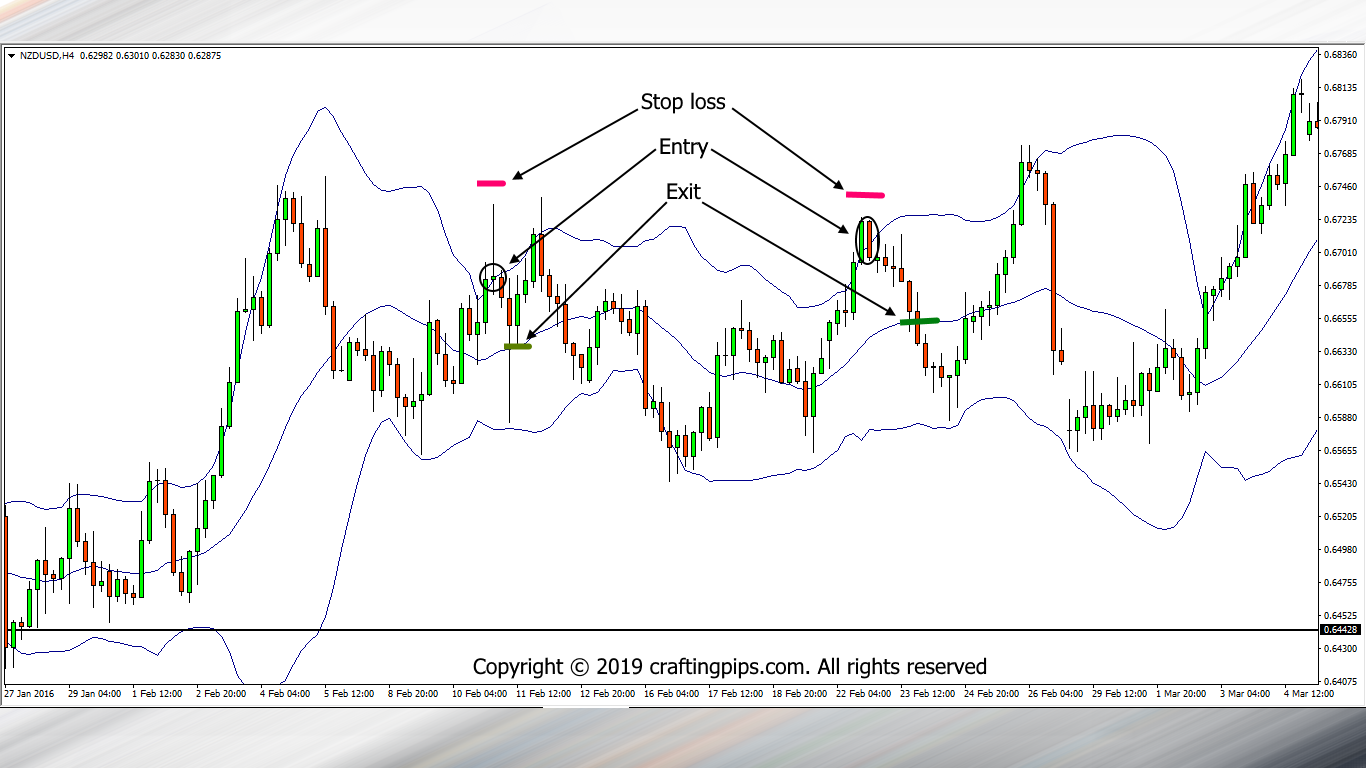
As seen in the chart above, the conservative trader depends on the middle Bollinger band to dictate where he places his stop loss.
This set of traders will exit a trade whenever price touches the middle bollinger band because there is the propensity for price to bounce off the middle band and head to their stop loss.
ii. Less-conservative trader
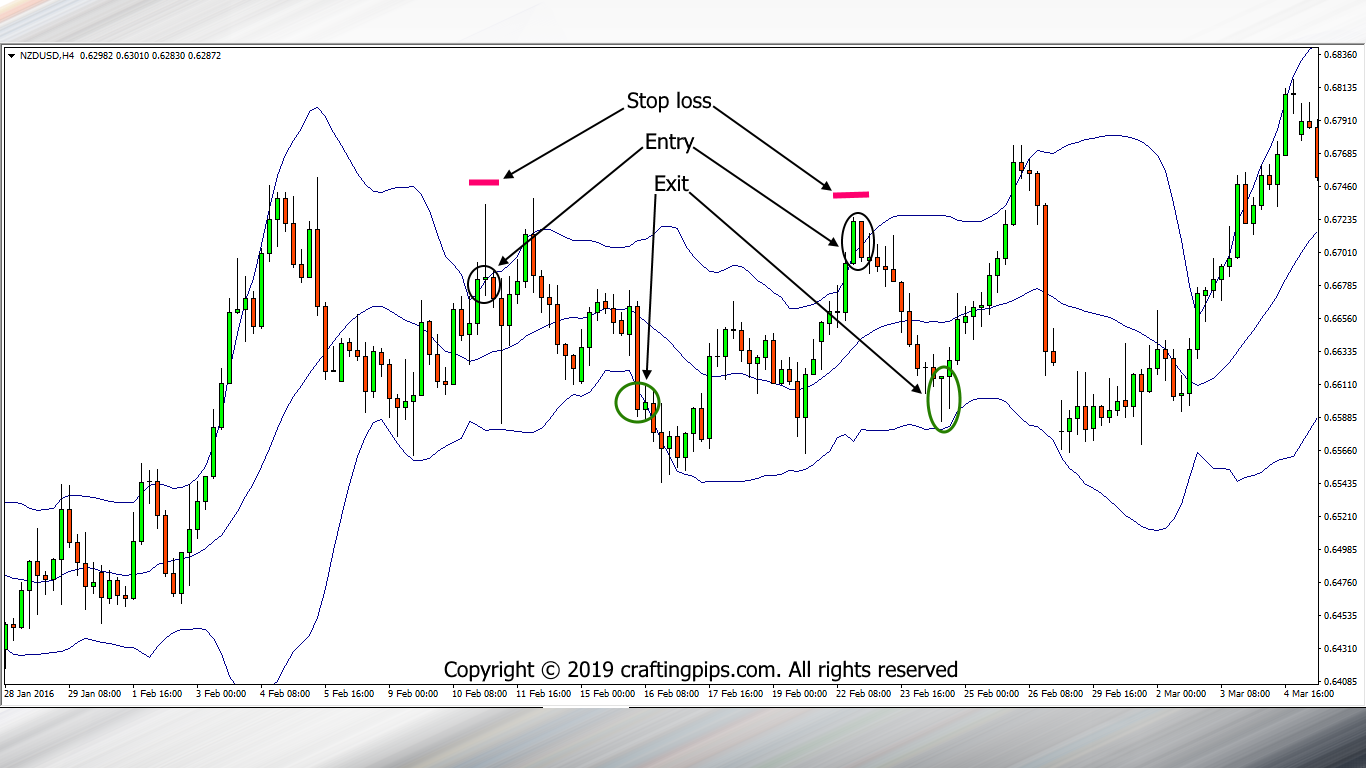
The less conservative traders don’t bother themselves with price reacting to the middle band because they know that price tends to continue a downward/upward move after testing the middle band in MOST cases.
Practicing either of the methods depends greatly on the trader’s psychology.
In conclusion
the Bollinger Band is a versatile and valuable tool for traders, regardless of their experience level. It offers several benefits and uses that can enhance trading strategies and decision-making.
By encapsulating price within its bands, the Bollinger Band helps determine high and low price levels, indicating potential buying and selling opportunities in ranging markets. Additionally, it aids in identifying periods of high and low volatility, allowing traders to be prepared for potential market movements. The Bollinger Band also assists in pattern recognition, enabling traders to detect early signs of reversals and other chart patterns.
Moreover, the Bollinger Band improves scaling in and scaling out techniques, providing opportunities for multiple entries at different price levels within a trade. It simplifies the placement of stop-loss orders, offering clear guidelines for risk management in both ranging markets and breakouts. Furthermore, the Bollinger Band provides well-defined entry and exit points, catering to both conservative and less-conservative traders’ preferences.
While the Bollinger Band offers many advantages, it’s important to remember that price patterns and market behavior can vary. Patience is key in identifying high-probability setups that align with the Bollinger Band. Additionally, implementing a robust money management system is crucial to protect capital during unfavorable market conditions.
Whether you already use the Bollinger Band or are considering incorporating it into your trading strategy, it is a tool that can enhance your analysis and decision-making process. By leveraging its benefits, traders can gain valuable insights into price dynamics and improve their overall trading performance.
That said…
Do you use the Bollinger band, and if so, how different do you use it when compared with the illustrations given?
Lastly, for those who don’t use the Bollinger band, are you considering using it after our article on it?
Please comment below.
![]()
![]()
![]()
![]()
![]()
![]()
One thought on “THE BOLLINGER BAND”