Good day traders
Are we set to take March by the bulls?
If YES…
Let’s hit the charts.
1. GBP/USD
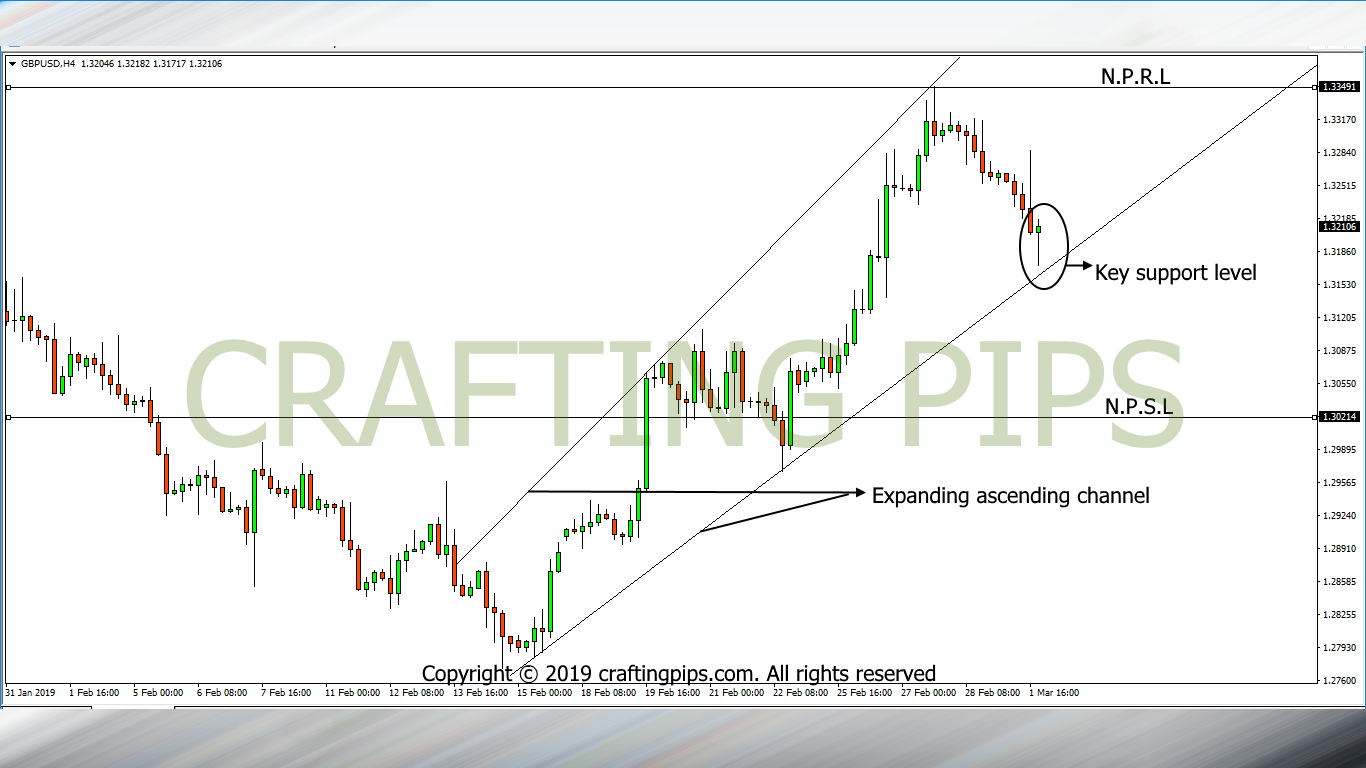
With the bullish pin-bar on the 4 hours chart of the GBP/USD, One will instantly assume that the bulls are lurking around the corner.
Well, that belief may not be too far from the truth, but I am personally bearish biased due to some certain factors:
- The USD closed on Friday flexing so much muscle. Most pairs knelt at its awesomeness before the market closed.
- The GBP/USD on the daily chart has met a key resistance level, hence price bearish move after Wednesday’s market close.
For these reasons, I would wait to see price’s reaction to trader’s bias as soon as the market opens on Sunday.
One thing to note is:
If the current support level (1.31690) is broken, price will start another downward spiral to the next support level (1.30214).
However, if the current support level stands strong, the bulls may take price back to resistance level 1.33340.
2. AUD/USD
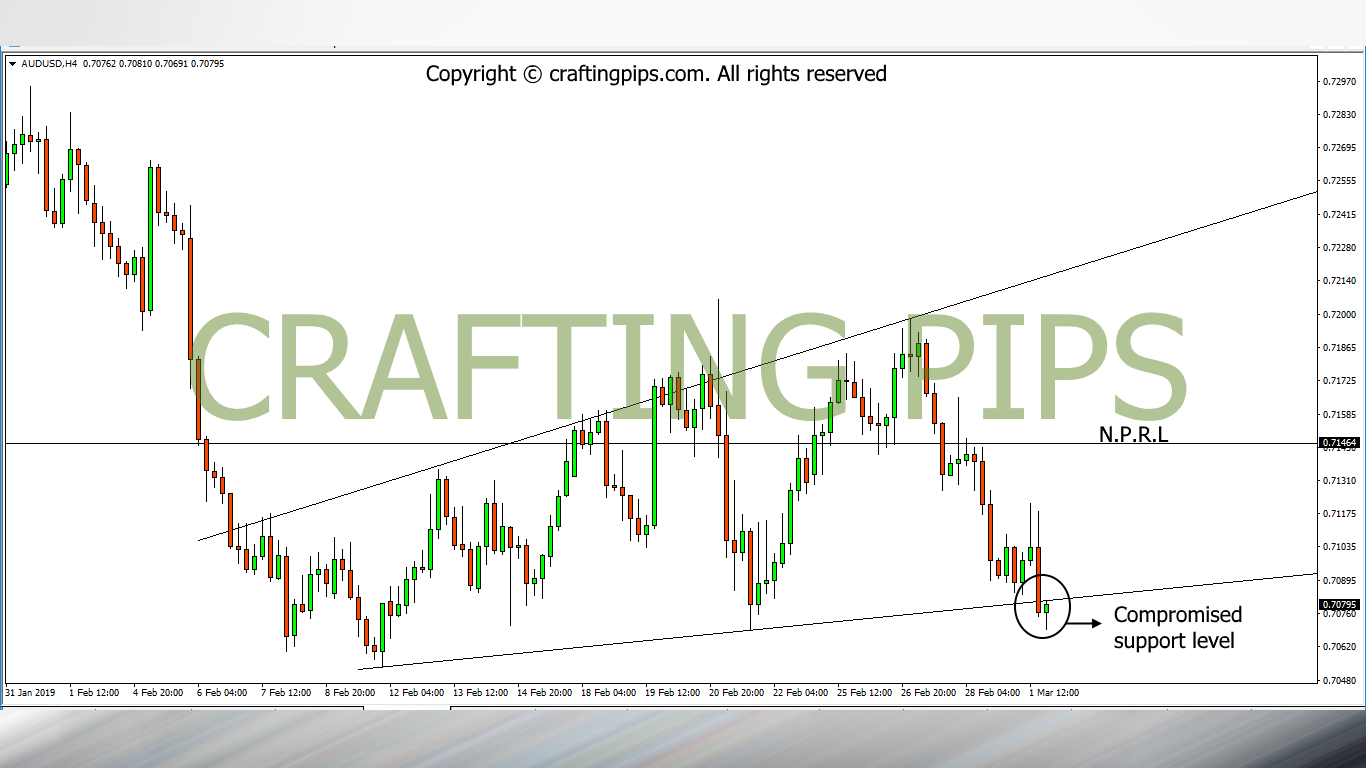
On the 4 hours chart, a breakout on the AUD/USD is about to occur, or has it?
On the daily chart, price is playing in-between a horizontal channel and the bearish strength seems to be strong. On the 4 hours chart, we would need more confirmation before attempting a sell.
If the downtrend is confirmed, it means support level 0.70801 would have failed to hold price. Hence, further confirming price’s next support level (0.70396).
If support level 0.70801 holds strong, price may most likely hit resistance level 0.71464.
3. EUR/CAD
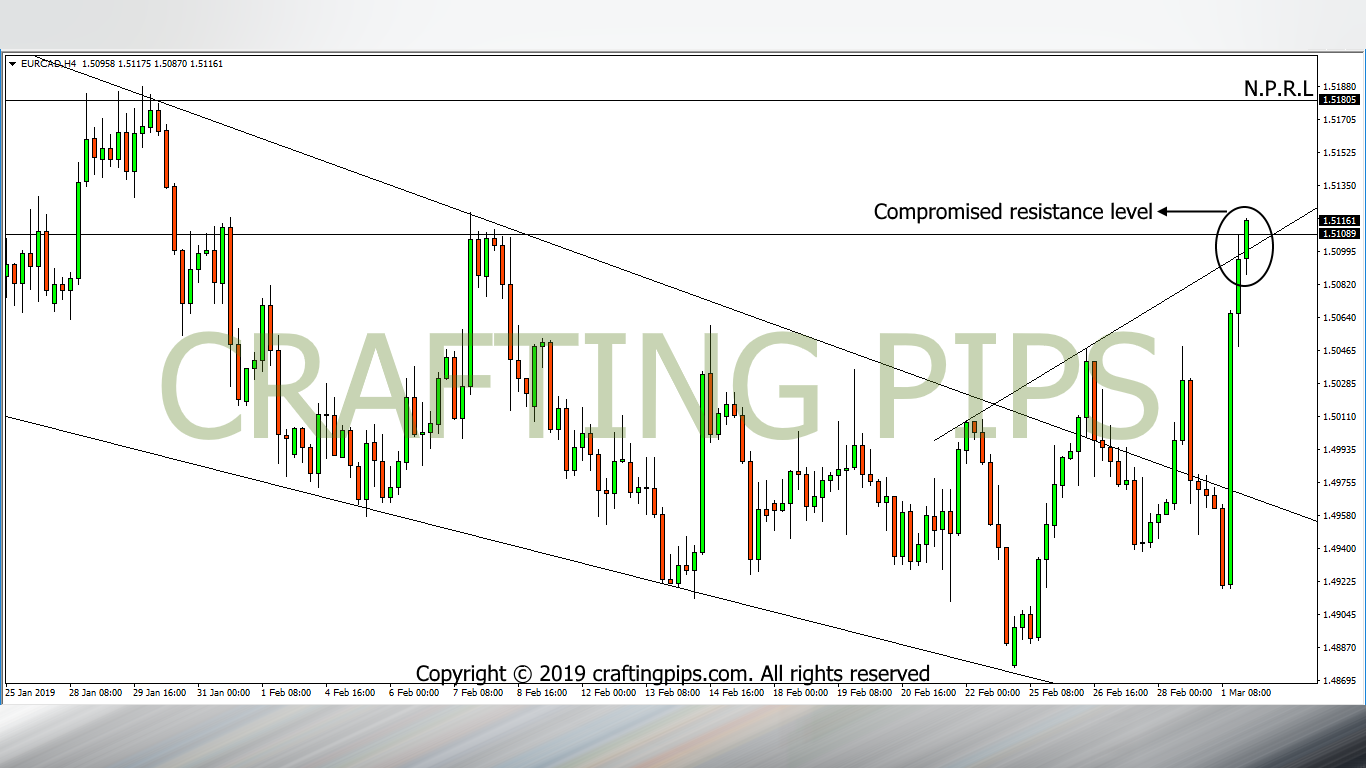
EUR/CAD on the 4 hours chart has broken a key resistance level (1.51089).
All we need is a confirmation of the breakout in order to ride this trend to the next possible resistance level (1.51805).
4. EUR/NZD
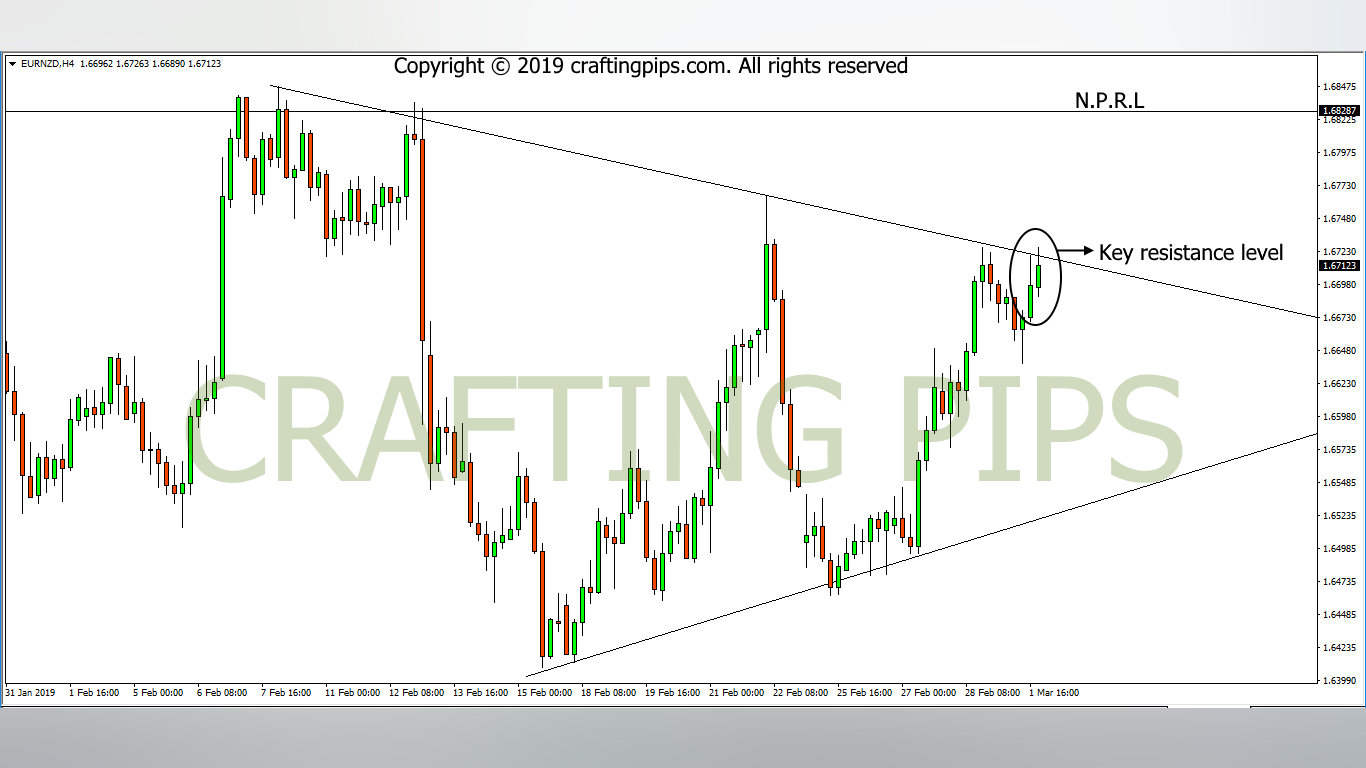
EUR/NZD gave us a fake reversal signal on Friday, which is typical of Fridays.
Price on the weekly chart seem to have hit a key support level (1.63959), hence the bullish price reaction.
If price breaks out from the present resistance level (1.67203), the bulls may take price to the next possible resistance level (1.68287).
Though I am bullish biased regarding this trade, we still have to wait for a confirmation before taking this trade.
We should also have it in mind that, if price falls below level 1.66381, the bears may take price below price level 1.65695.
We are through with our weekly analysis. We will closely monitor these trades during the week as they become viable to trade in.
Kindly join our facebook group (https://www.facebook.com/groups/pipcrafters/) in order to get free trade calls you can trade every week and also some tips that could be beneficial to you in your trading career.
We would also appreciate if you comment below, as regards your bias on the setups we just analyzed and please share our analysis with your pip loving friends.
Don’t forget to subscribe while at it… IT’S FREE!!!
Do have a grand week ahead
![]()
![]()
![]()
![]()
![]()
![]()