Happy Sunday Fellow Traders,
It’s been a great weekend for me and I am seriously pumped for the new month. We need to make February (The month of love) count.
Meanwhile, how was your weekend?
I am guessing it was great.
That settled, Let’s hit the charts together.
1. EUR/CAD
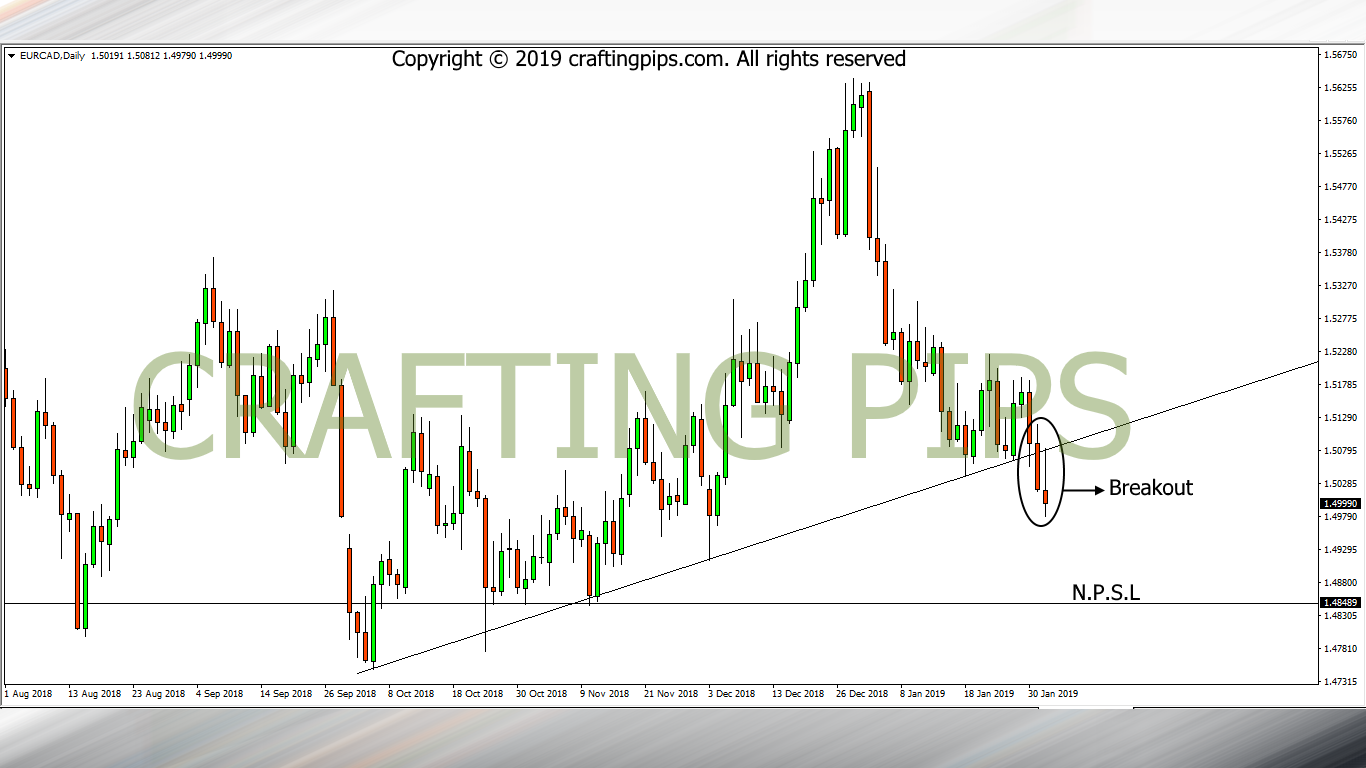
EUR/CAD on the daily time frame, broke out from an ascending support level, pulled back on Friday, before it continued it’s bearish run.
There is every likelihood that EUR/CAD will hit the next possible support level (1.48489) before the week run’s out.
2. CAD/JPY
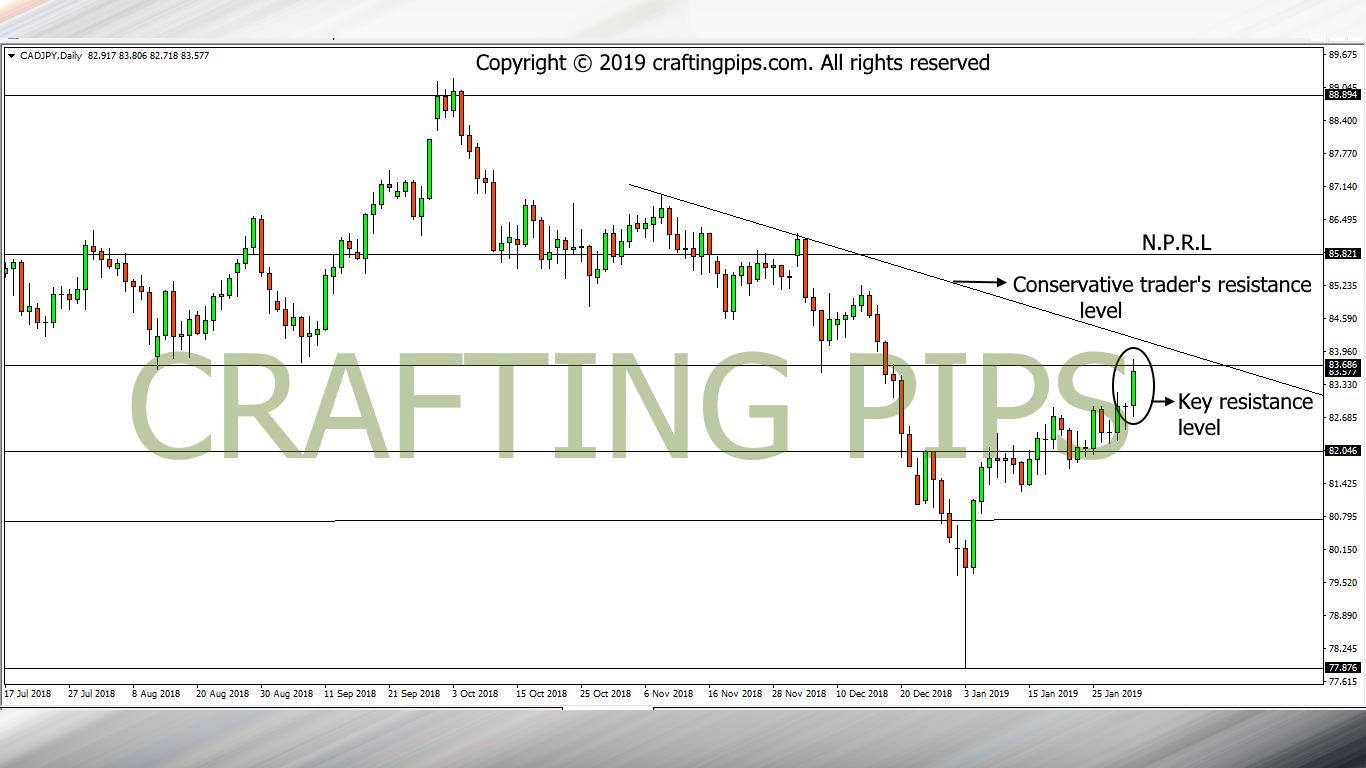
Viewing CAD/JPY through the daily time frame, we can see that the bulls have taken price to a key resistance level (83.686).
Let’s not forget that there is also a descending resistance line almost touching the present horizontal resistance line containing price. For the conservative traders, it’s advisable that price should break out from the descending resistance line before committing to the bulls.
If price fails trying to break any of the resistance level, we may most likely see price return to support level 82.046
3. NZD/USD
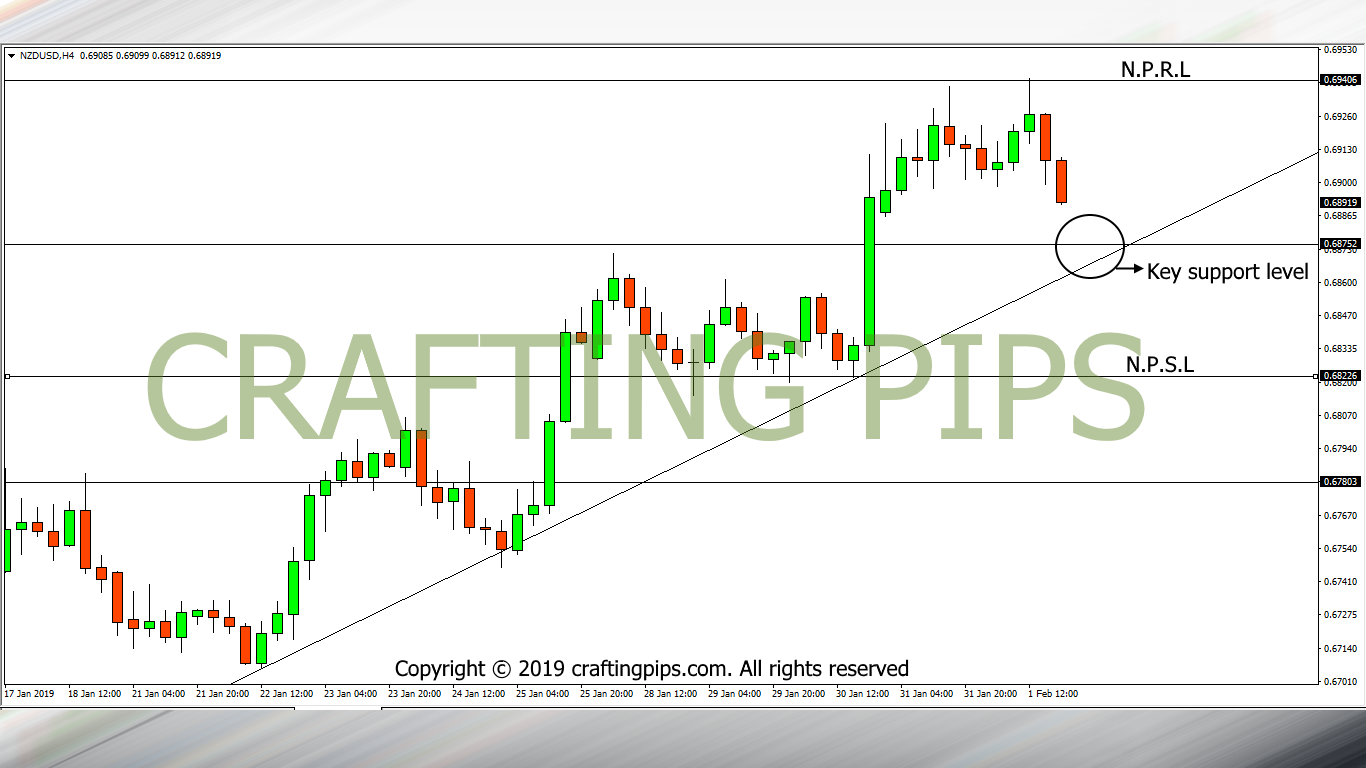
NZD/USD on the 4 hours chart looks interesting.
NZD/USD On the daily time frame hit a key resistance level (0.69406), spent two days trying to break through the resistance level, before the bears finally kicked in.
Presently we have a key support level (0.68752) which may serve as a confirming sell signal if broken. If price breaks support level, we may most likely see price hit the next possible support level (0.68226)
Support level 0.68752 may also serve as a spring board to price. If that happens, there is every likelihood that price will return to price level 0.69406.
4. AUD/USD
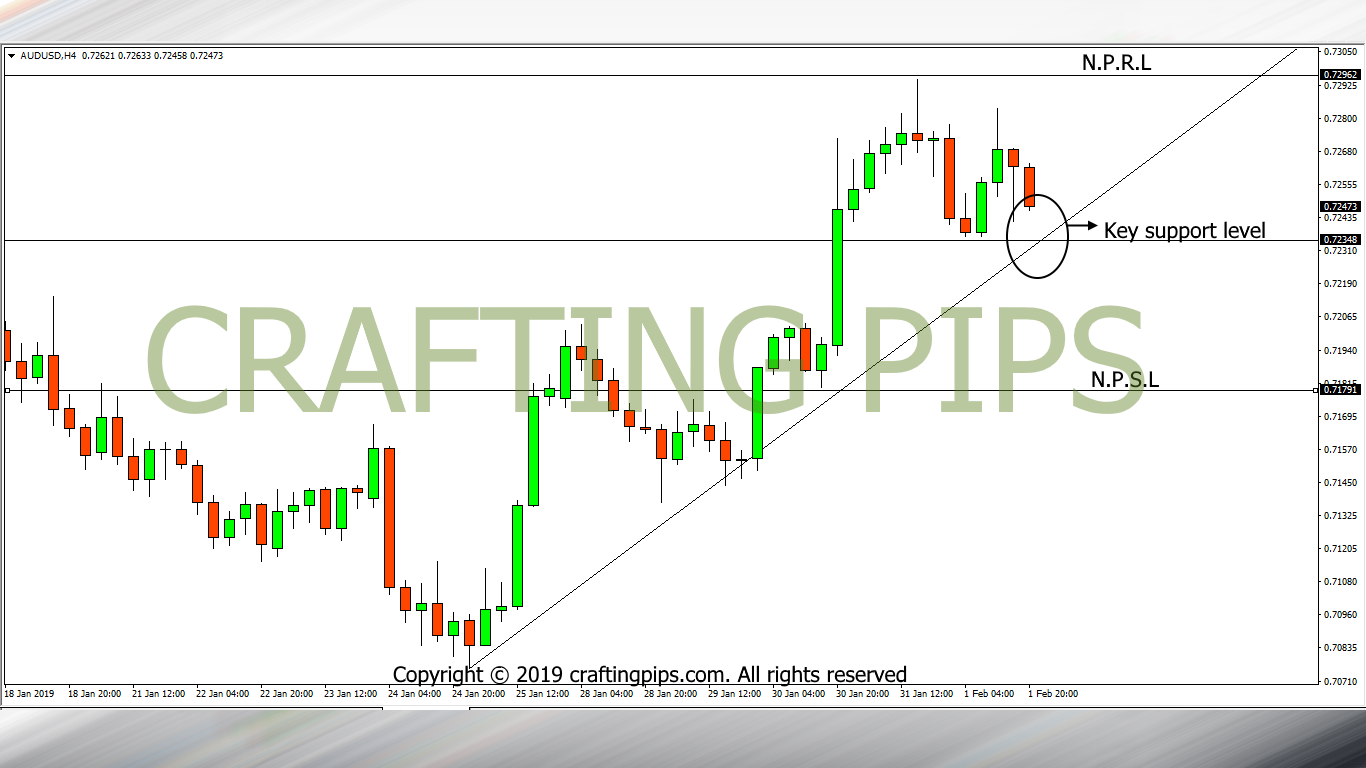
On the daily chart, AUD/USD has an engulfing bearish candlestick that was formed at the close of market on Friday.
On the 4 hours chart, we can see an ascending and horizontal support line (0.72348) providing support for price. A bearish breakout of the current support level may lead the bears to take price to the next possible support level (0.71791)
If the present support level refuses to breakout, the bulls may encourage price to revisit price level 0.72962.
We finally done with our weekly analysis. I hope you already have an idea of how to go about your trading this week?
We would love to have your views on our analysis, we would also appreciate if you share our analysis with your pip loving friends, and also subscribe if you don’t mind getting our daily analysis of the market.
![]()
![]()
![]()
![]()
![]()
![]()