Good day traders,
It’s another beautiful week for us. I hope everyone is well rested and ready to take on the market.
Let’s go see some important charts we should be paying attention to this week.
1. GBP/USD
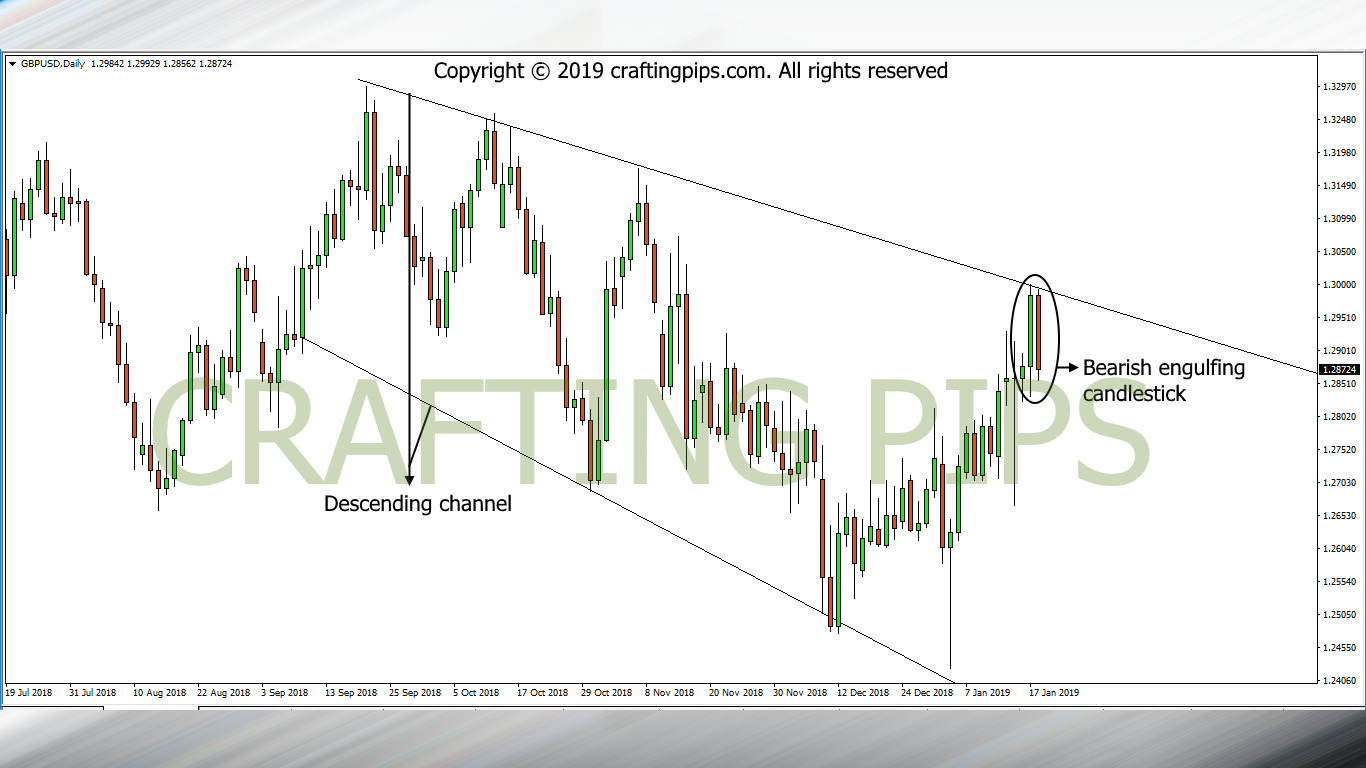
GBP/USD closed with a bearish engulfing candlestick on Friday.
A descending channel is calling the shots on this pair. In my opinion, we may most likely see the bears take market to the next support level (1.24840).
That said, caution is applied as we anticipate the sellers coming into the market. Sunday’s and Monday’s are known to be unpredictable in the market.
IF… Just IF, we get to see a breakout from the resistance (1.29985), the bulls will definitely take price to the next resistance level (1.31762).
Personally, I believe the market could open with a bearish gap. If that occurs, we should be looking out for bearish entries. If GBP/USD doesn’t open with a gap, I will be looking out for how the market will react before the close of the New York session on Monday before I commit.
2. EUR/USD
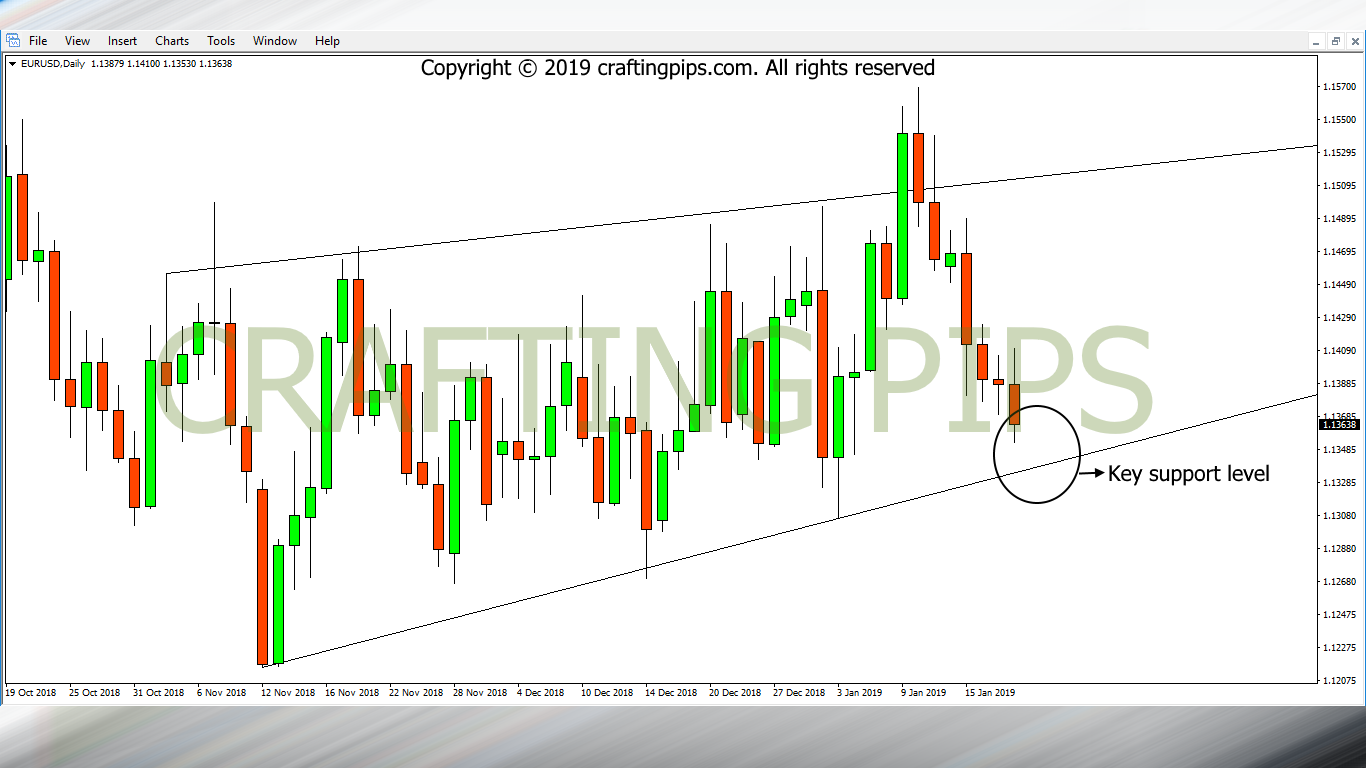
EUR/USD on the daily chart is locked within an ascending channel.
When looking at the pair closely, you will observe that since the 12th of November 2018, the pair has continuously bounced off the support level of the present ascending trend, roughly every month.
This month, there seem to be a twist to it. This week may be the second time this pair will be revisiting the support level of this ascending channel within a month.
What does that tell us?
There seem to be an accumulated bearish pressure on EUR/USD in the market. We may see the Euro fail a bounce at support level (1.13387). If it does, the sellers may most likely drive price to the next support level (1.12692).
If the breakout fails…. Resistance level 1.14706 should be price’s next bus stop.
3. EUR/CAD
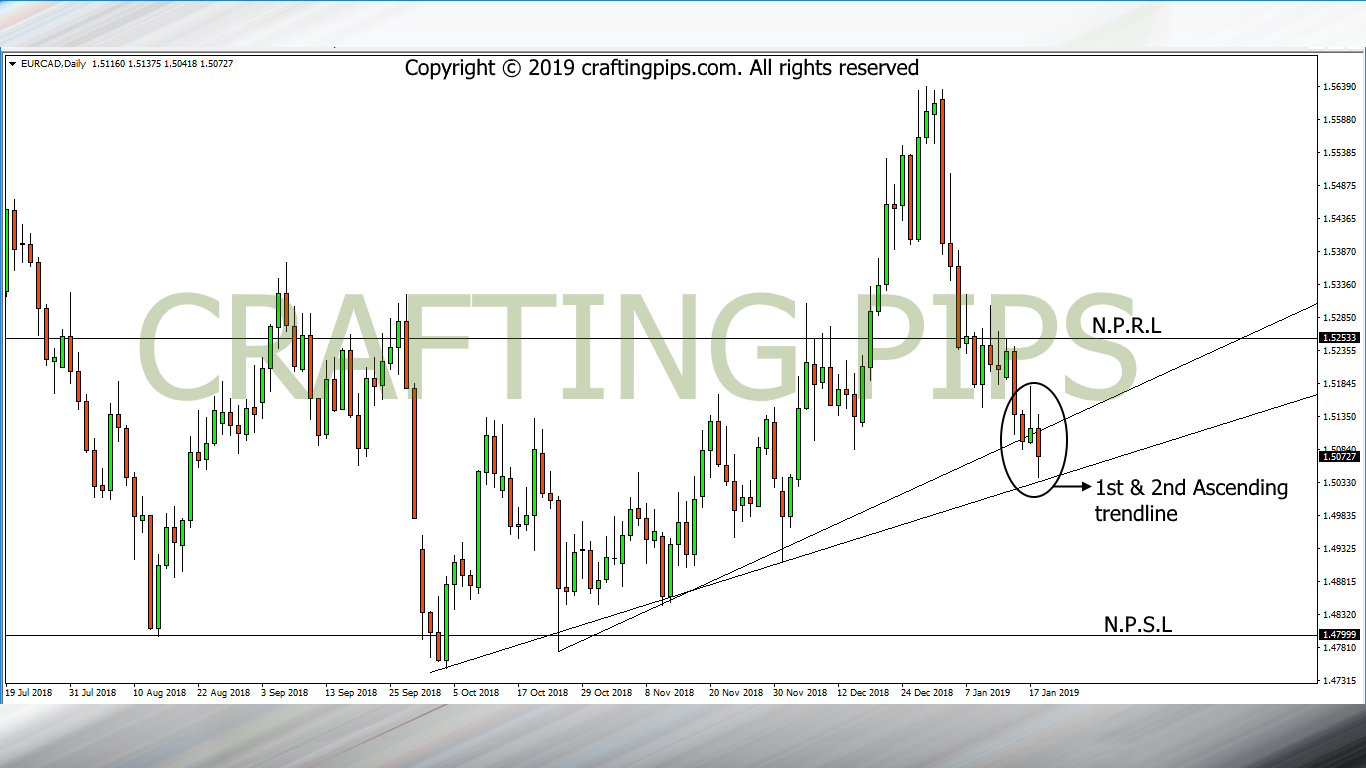
EUR/CAD is presently testing a conservative ascending trend line (1.50385). Last week the same pair broke out from a liberal ascending trend line (1.51098) which we emphasized on. If you missed it, you can check here
If a breakout through the present resistance level occurs, we may most likely see sellers drive price to the next possible support level (1.47999)
If a reversal occurs, the bulls should take price to the next possible resistance level (1.52533)
I hope you already have an idea of how to tackle the market this coming week?
Post your comments if you support or have contrary views, share if you have friends that love making pips and subscribe if you need our daily market analysis sent to you via mail.
Do have a pip-full week ahead.
![]()
![]()
![]()
![]()
![]()
![]()